In order for IOTA Vue to access data on InfluxDB Server - the IOTA InfluxDB-Driver must be configured and deployed on network
which has access to required InfluxDB Servers. The IOTA Vue uses distributed "mesh-like" data source topology:
Users are free to define what Region and Site mean for their unique deployment.
| Name | Example | Description |
|---|---|---|
| Region | us-east-1 | geographical territory, similar to availability regions |
| Site | siteB | specific plant or a building |
To simplify the installation process, the IOTA Software provides a container image with the latest driver version. The
user is only required to select/create a region and site. Then for the selected driver type, click add a new server.
The container contains all necessary InfluxDB-Driver configurations with public and private keys for secure communication
with the company's IOTA Vue NATs message bus.
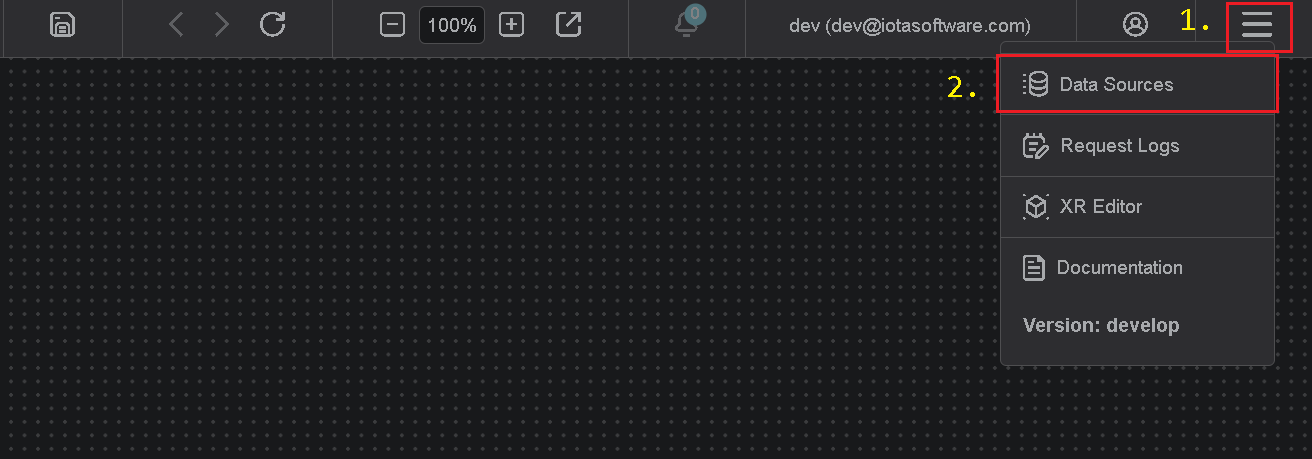
To Access the Data Sources menu, click at the top right corner on the "hamburger" icon, then select "Data Sources".
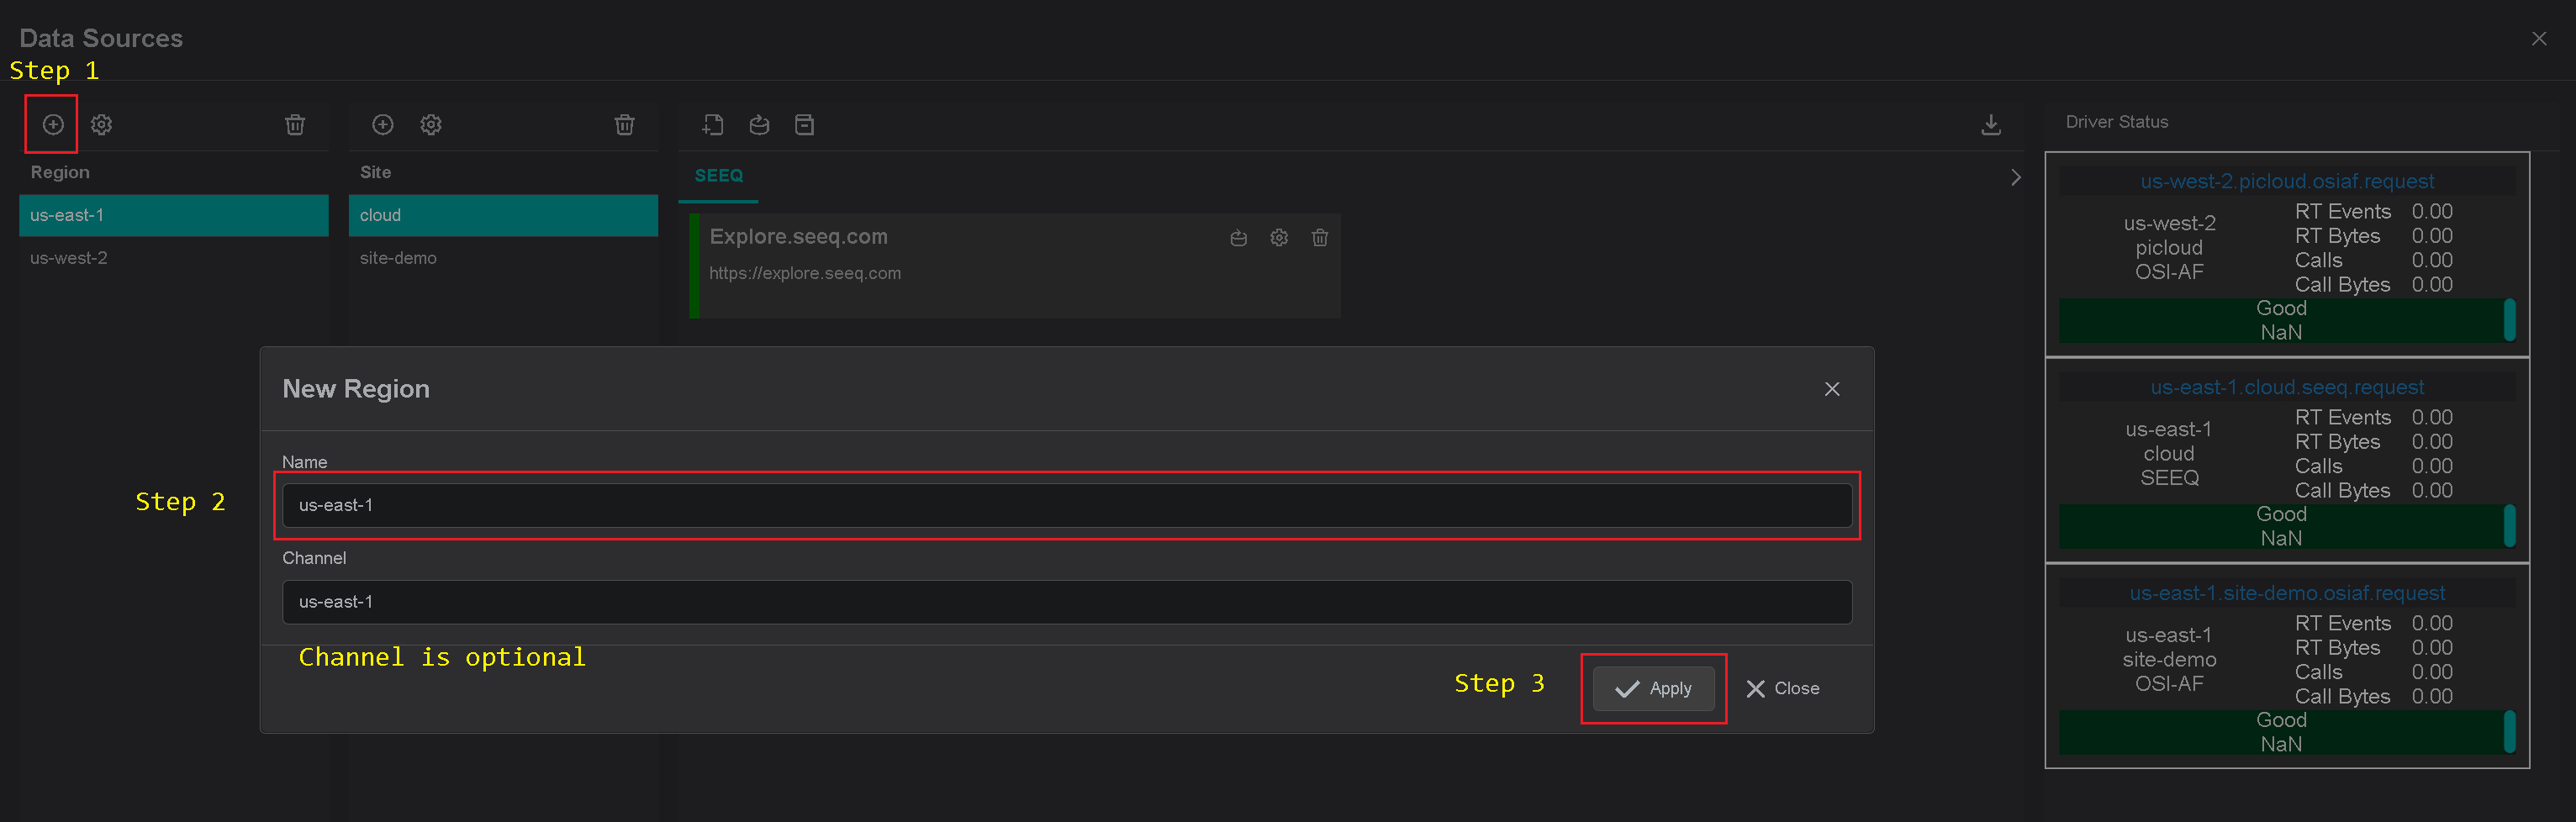
Add Region
Click on the "Add" icon to add a new site, then in the popup dialog - enter the site name. Make sure the Influx-DB checkbox
is selected. Each site can contain multiple driver types. For each checked driver type - the instance pane will contain
selected driver tabs to which connection instances can be added.
There are two input fields:
- Site name
- Channel name (optional)
The site name is a user-friendly name, and the channel name can contain abbreviations. If the channel name is not
provided, it is automatically assigned to the site name on the "Apply" button click.
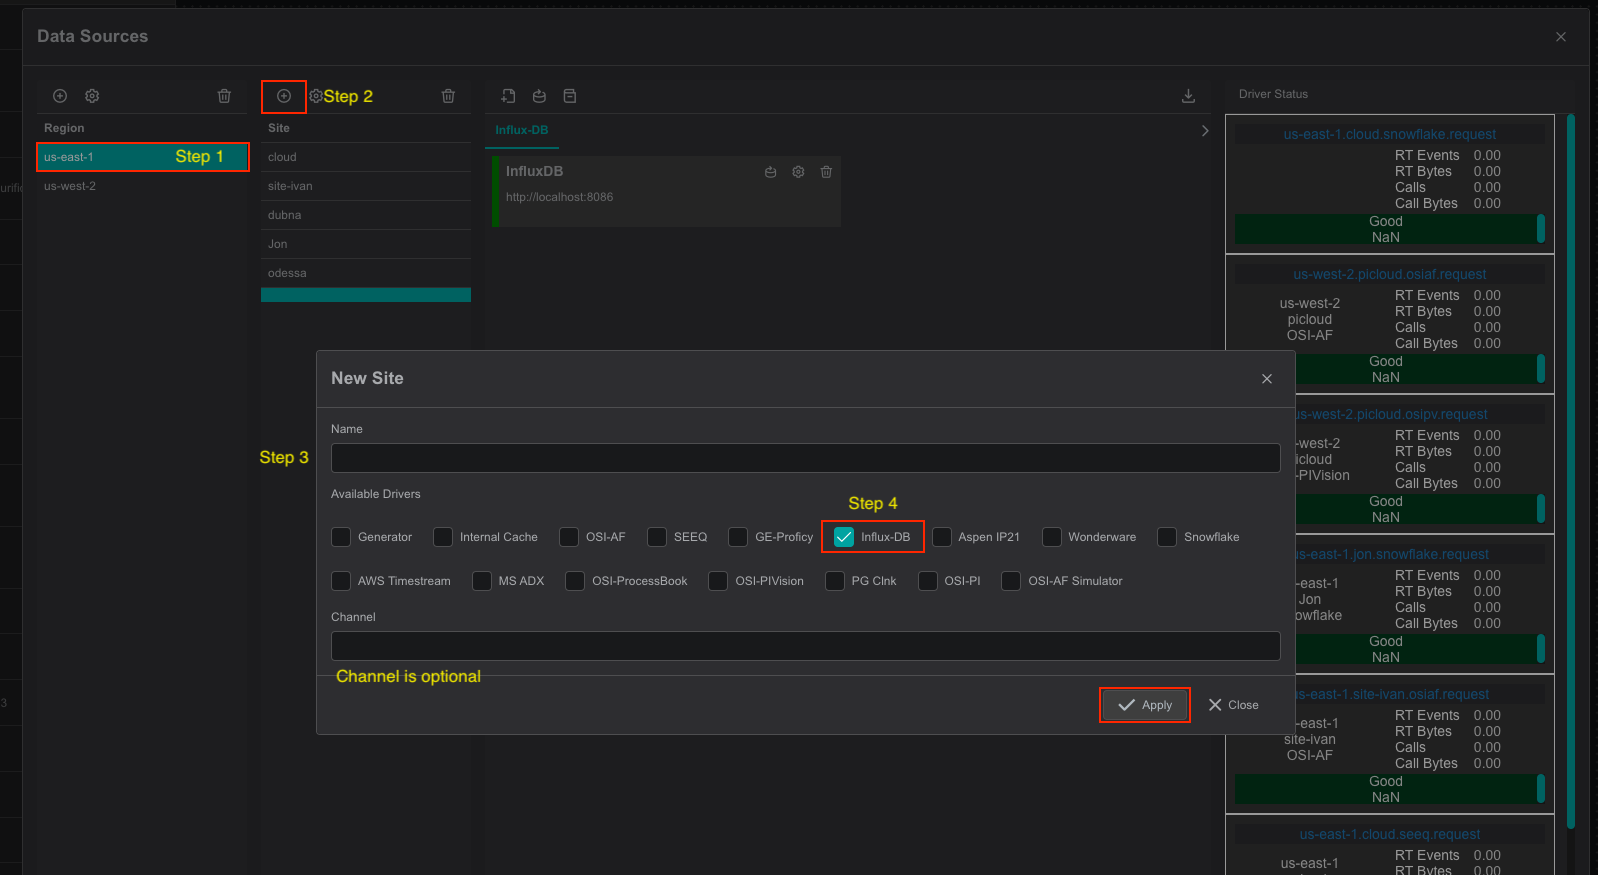
Add Site
Click on the "Add" icon to add a new site, then in the popup dialog - enter the site name. Make sure the Influx-DB checkbox
is selected. Each site can contain multiple driver types. For each checked driver type - the instance pane will contain
selected driver tabs to which connection instances can be added.
There are three input fields:
- Site name
- Driver type
- Channel name (optional)
The site name is a user-friendly name, and the channel name can contain abbreviations. If the channel name is not
provided, it is automatically assigned to the site name on the "Apply" button click.
Add connection
The InfluxDB-Driver container is automatically available in the IOTA Vue data sources section configured for specific
Region\Site.
Tips
The installer already contains all required configurations for specific Region\Site connectivity.
To add a new InfluxDB server connection navigate to data sources menu, then:
- Select region of interest
- Select the site of interest
- Select the InfluxDB Driver tab named "Influx-DB" within the selected site.
- At the top right corner - click on the "Add" icon.
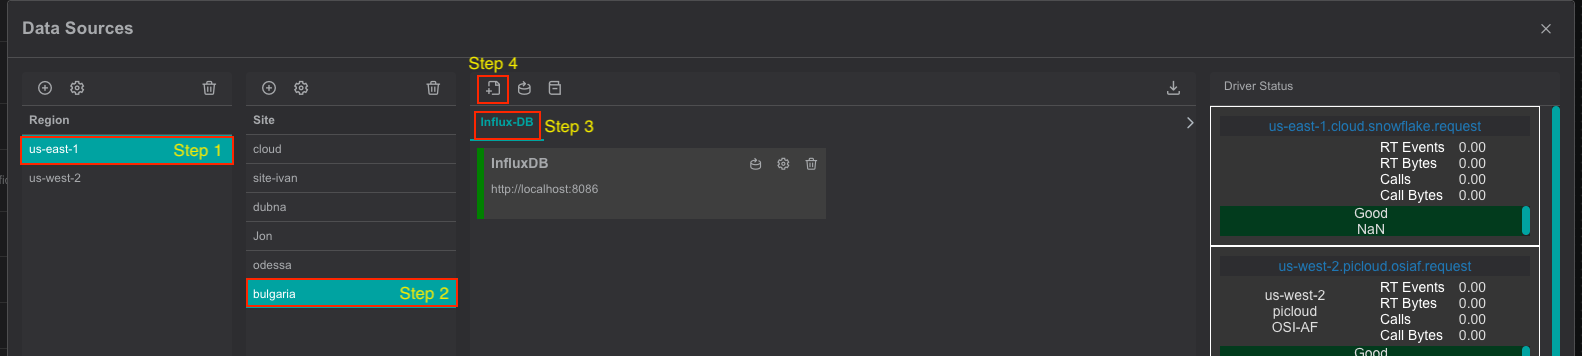
The InfluxDB-Driver's connection dialog will appear.
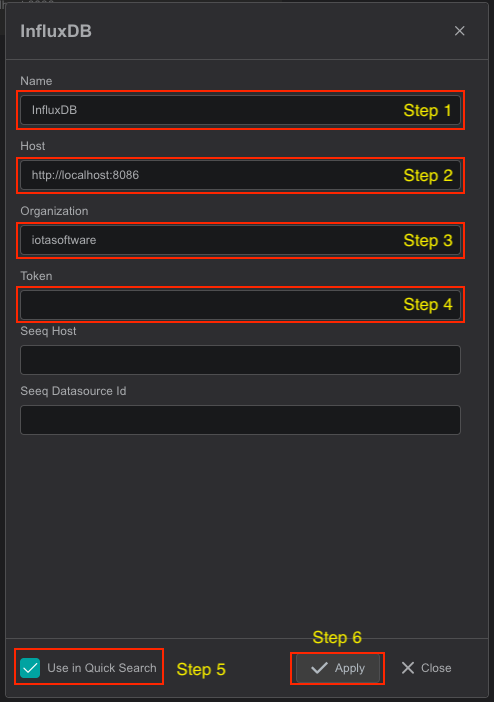
- Provide a name for the InfluxDB Connection. All search results will be prefixed with this name
- Specify the InfluxDB server name or IP address.
- Specify the organization name
- Specify the token
- Please check the "Use in Quick Search" checkbox if InfluxDB Connection should be used in the quick search sidebar. If not
checked, the configured connection will only be available in Advanced search. - Click on the "Apply" to save changes.
If InfluxDB Connection has the "Use in Quick Search" checkbox selected, it becomes available in a quick search sidebar.
Driver Configuration
On every startup the InfluxDB-Driver reads its configuration from the environment variables.
Tips
The InfluxDB-Driver comes with a pre-configured environment. Therefore, manual configuration is not required.
Configuration parameters
| Environment name | Required | Default Value | Data Type | Description |
|---|---|---|---|---|
| DRIVERID | ⚫ | "" | string | Driver Id - used for logging purposes only |
| LOG_LEVEL | ⚫ | ERROR | string | Debug verbose level: ERROR, DEBUG, INFO |
| NATS_HOST | 🟢 | null | string | NATs server url with port |
| SEED_KEY_PATH | 🟢 | null | string | NATs NKey public key string. Private key must be defined in file: "privatekey.nk" |
| RQS_TOPIC | 🟢 | null | string | NATs topic on which driver listens for requests |
| HEALTH_TOPIC | ⚫ | "" | string | NATs topic for sending driver's health |
| HEALTH_SCHEDULING | ⚫ | 10000 | int | How often in milliseconds to send health data. Default: 10000 = 10 sec |
| LOGS_TOPIC | ⚫ | "" | string | NATs topic for sending driver's logs |
| METRICS_TOPIC | ⚫ | "" | string | NATs topic for sending driver's metrics |
| METRICS_SCHEDULING | ⚫ | 30000 | int | How often in milliseconds to send metrics data. Default: 30000 = 30 sec |
| ENABLE_METRICS | ⚫ | true | bool | Enables metrics reporting |