The Adhoc Trend enables fast, on-demand data visualization without the need to create dashboards. It supports exploratory analysis, quick comparisons, time-based statistics, and contextual investigation—directly from views or search results.
Use Cases
Typical scenarios for Adhoc Trend include:
- **Investigating anomalies**: Identify outliers, spikes, or deviations.
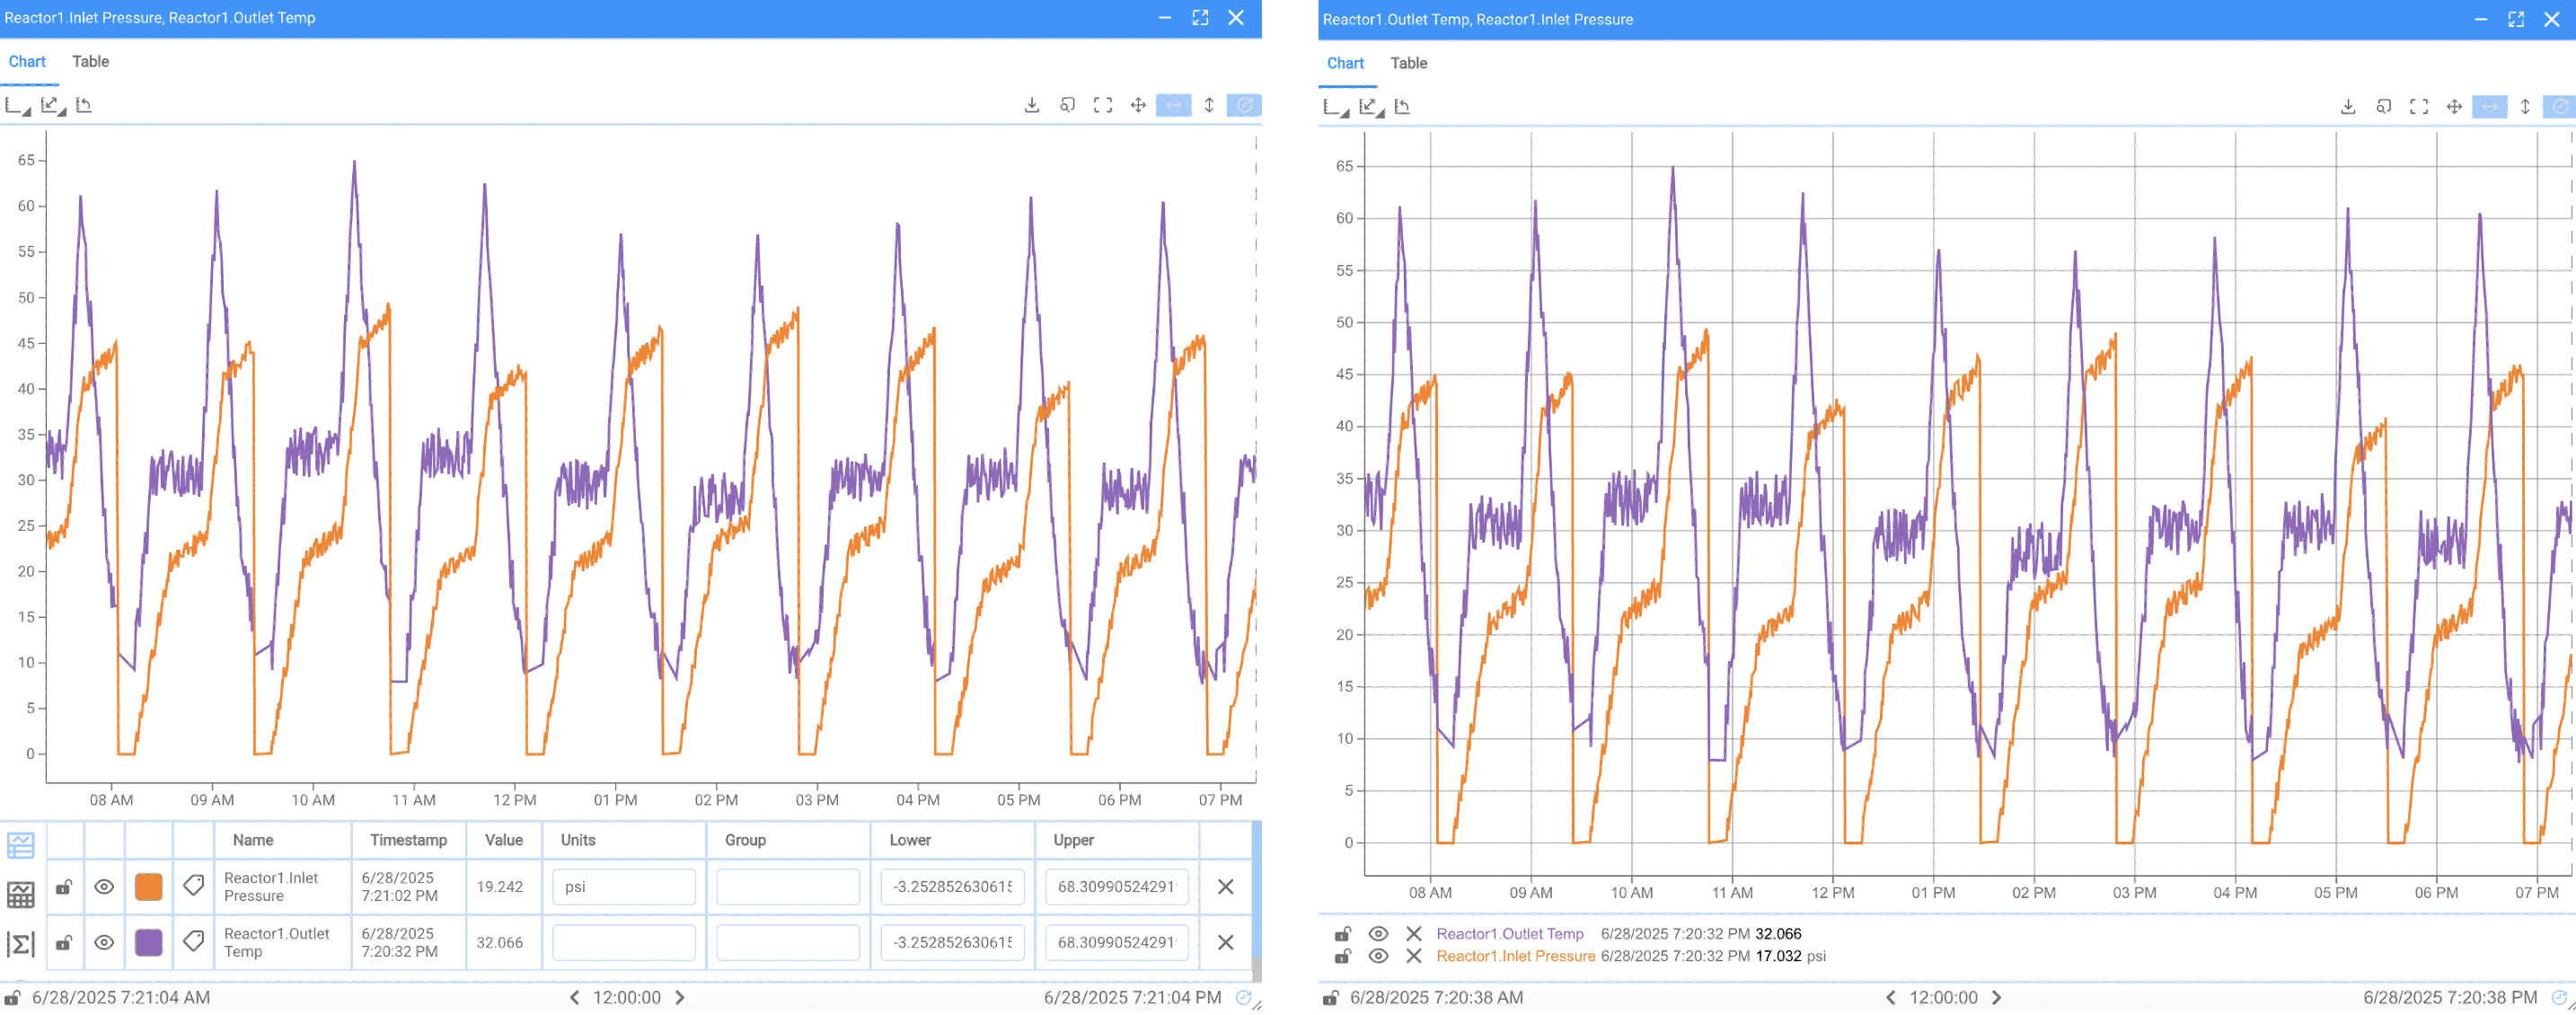
- **Comparing data**: Analyze channels across different time periods, views, or data sources.
- **Exploring unmapped channels**: Visualize data directly from [search results](search.html).
- **Calculating changes**: Use cursors to analyze differences over time (see [Cursors and Statistics](#cursors-and-statistics)).
- **Combining data**: Visualize multiple channels side-by-side.
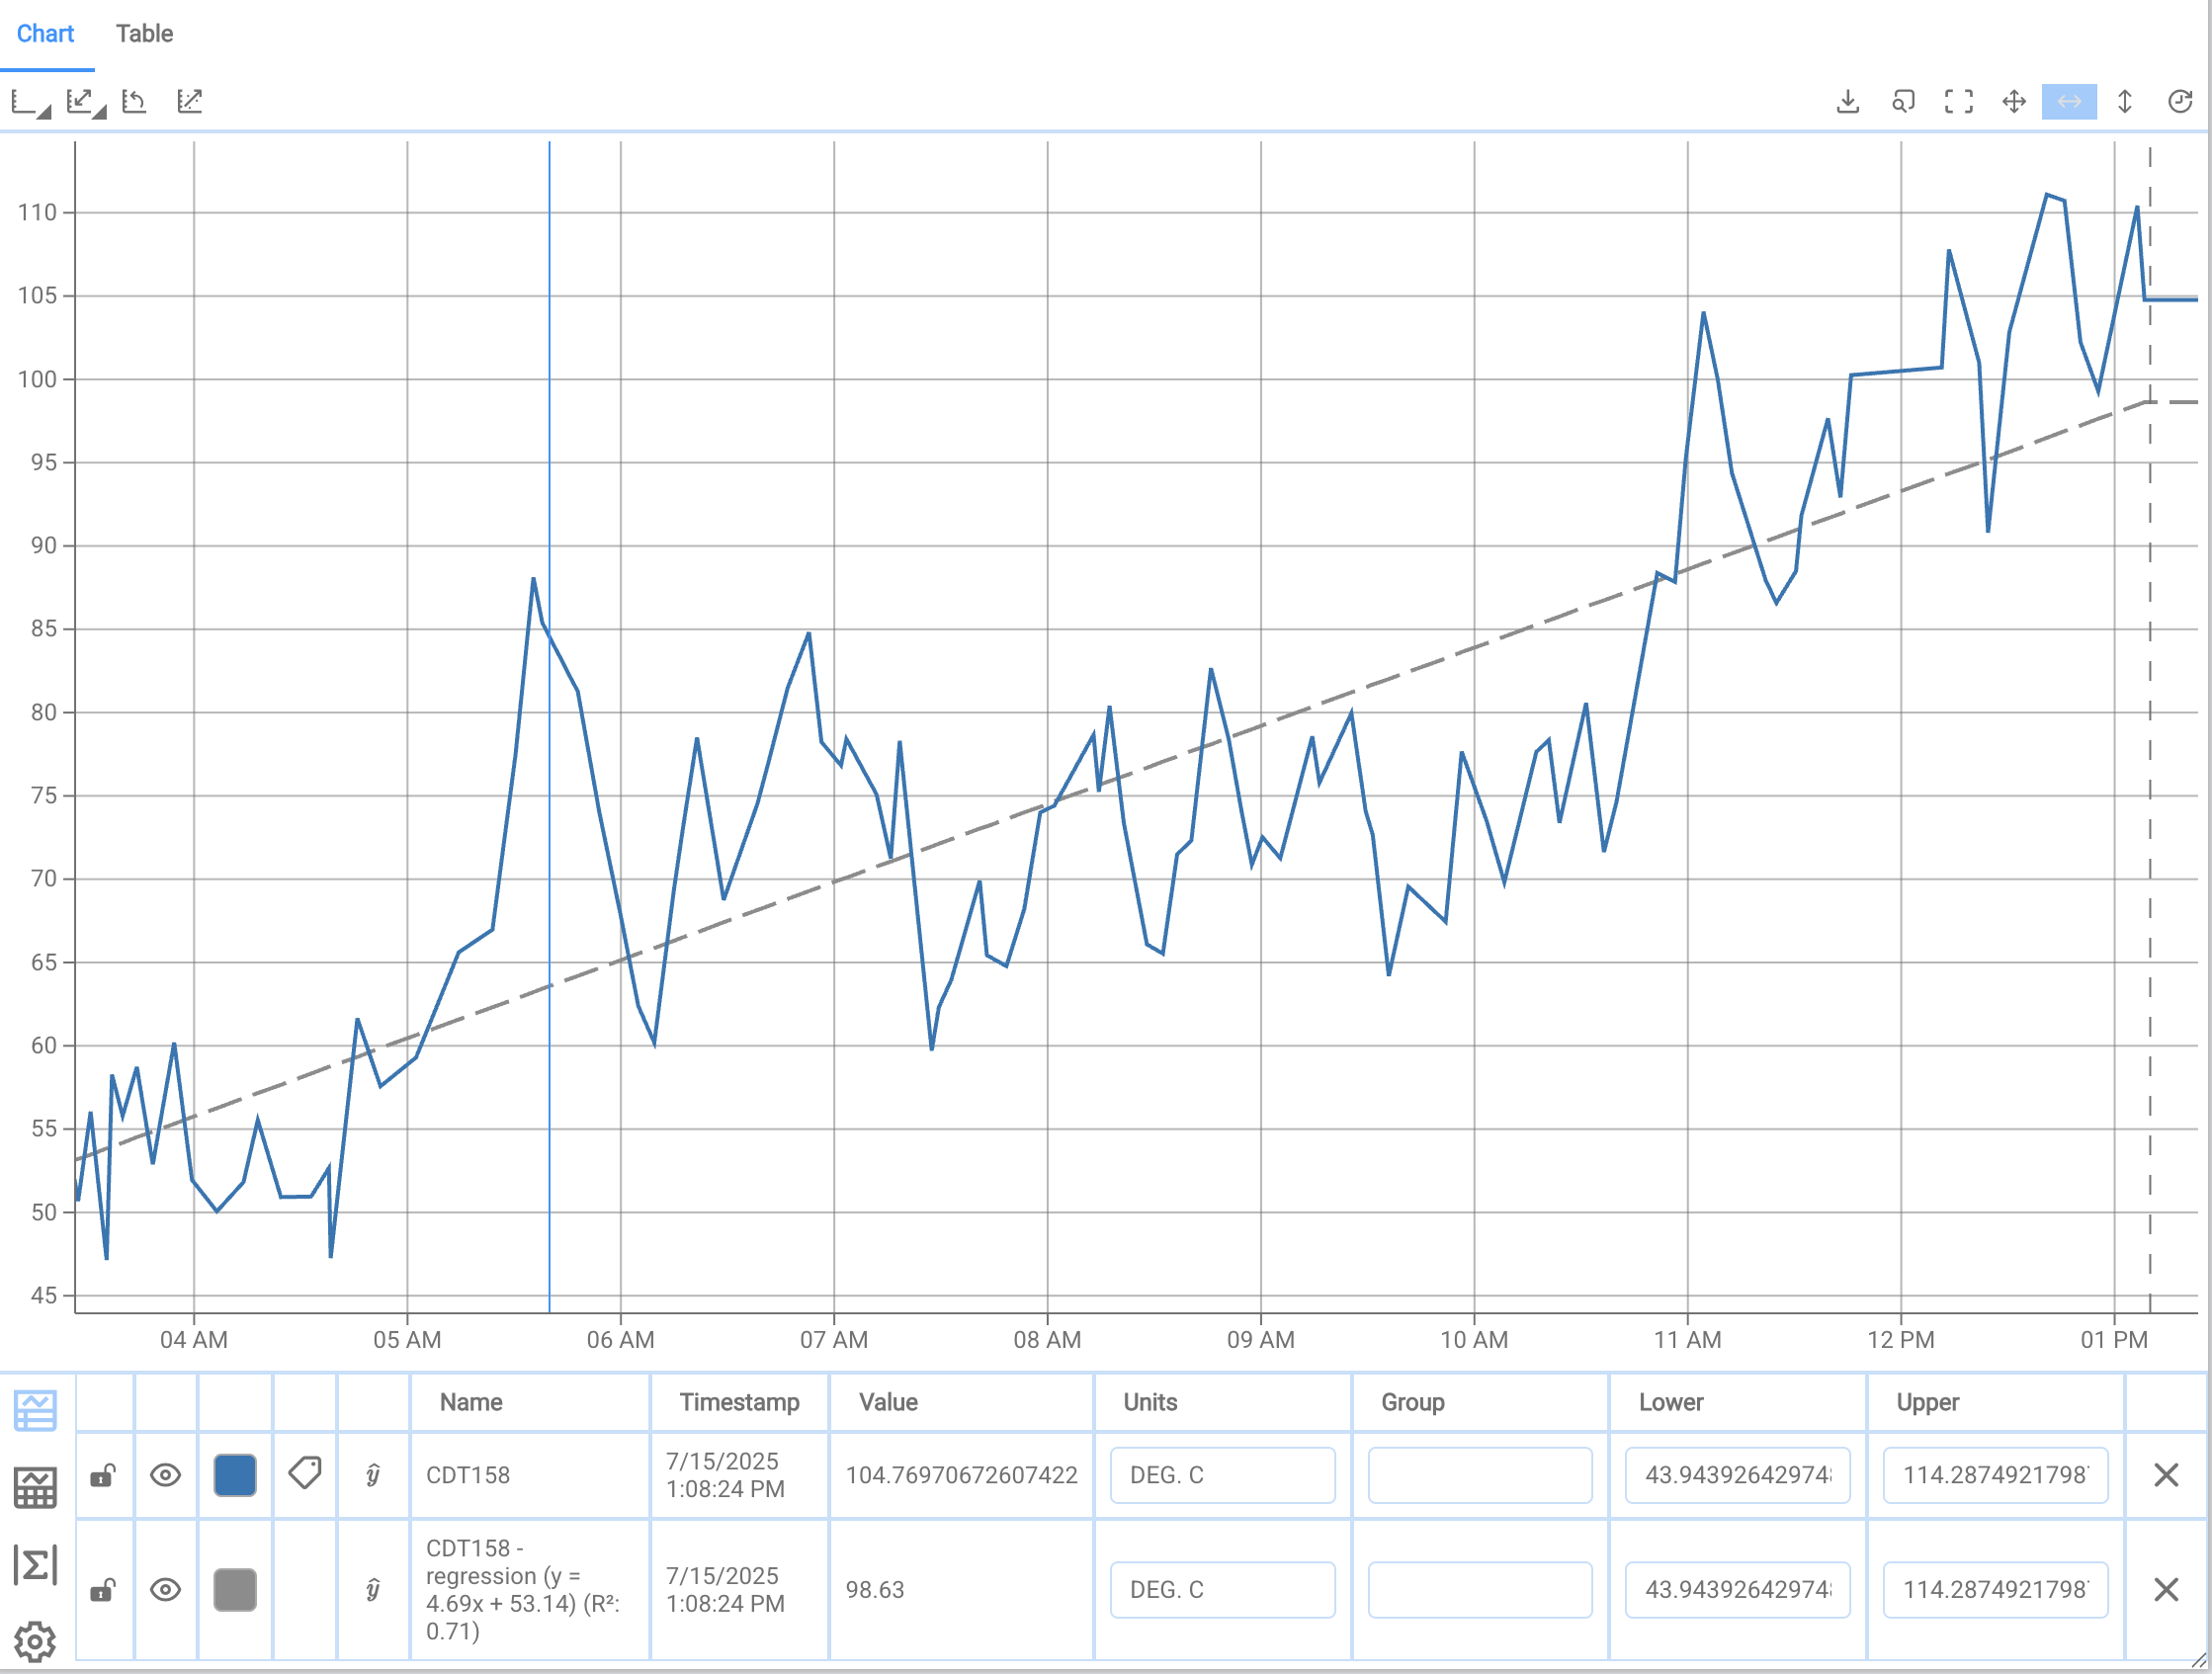
- **Identifying trends**: Overlay [Regression Lines](#regression-lines) to analyze patterns.
Opening Adhoc Trends
You can open Adhoc Trends from:

- **[A View](#open-from-a-view)** containing components with mapped data.
- **[Quick Search](#open-from-quick-search)** using individual channels.
Open from a View
You can open an Adhoc Trend from a view using one of the following methods:

- **Double-click** a component
- **Right-click** the component → `Show Trend`
- **Cmd/Ctrl + click** to select multiple components, then right-click → `Show Trend`

> ⚠️ The view must be locked to open an Adhoc Trend (see the lock icon in the top bar). If the view is unlocked, this action is disabled.
Open from Quick Search
- Search for a channel
- Double-click the result
⚠️ Make sure to double-click the channel name itself (e.g.,
BA:TEMP.1) — not all areas of the result row are clickable.
Add Channels to an Existing Trend
- Drag and drop channels into the open Adhoc Trend.
- Or double-click / right-click a channel→
Show Trend
(When double-clicking, make sure to click on the channel name itself)
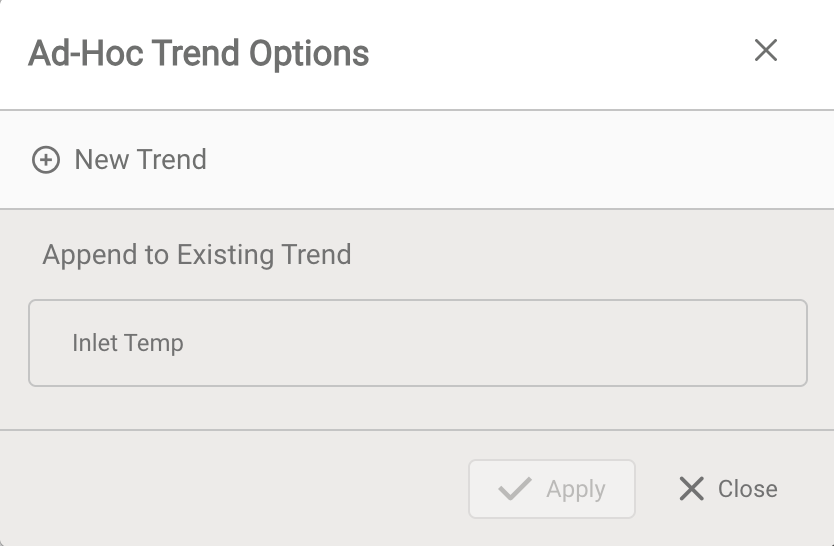
You’ll be prompted to choose:
- Create New Trend — opens a new chart
- Append to Existing Trend - select from the list and click
Apply
Tip
Adhoc Trends stay open while you navigate between views—perfect for cross-view comparisons.

Managing the Adhoc Trend Popup
- Resized via bottom-right corner
- Maximized using the expand icon in the top-right corner
- Collapsed using the
_icon in the top-right corner - Closed using the
×icon in the top-right corner
When collapsed, the Adhoc Trend appears as a small tab in the top-right corner of the view.
Click the expand icon on the tab to reopen it—your selected channels and settings are preserved.
The popup persists across view changes, making it easy to compare data between different views without losing context.
Configuration and Customization
General Settings
By default, the Adhoc Trend opens as a popup overlay. This can be changed in your User Profile Settings:
- Show Adhoc – Enables or disables Adhoc Trend feature
- Open Adhoc in New Window – Opens each trend in a separate browser window

Component Style
The Adhoc Trend interface is fully customizable through Component Style:
- Select interface areas (e.g., Channel Table, Legend)
- Arrange and resize areas via drag-and-drop
- Define behavior defaults (e.g., grid, individual scaling)
Once saved, a Component Style applies to every Adhoc Trend. Styles can be switched anytime via the component panel.
Default Areas
By default, Adhoc Trend includes:
Optionally, you can add the Channel Table for metadata, statistics, etc.
All interface areas are optional and can be freely added, removed, repositioned, and resized through Component Style.
Define Adhoc Trend in Component Style
To configure the Adhoc Trend layout using Component Style:
In the Tools section of the left sidebar, click Component Style.

Click the + icon to create a new style or the pen icon to edit an existing one.
In the Component Style editor, scroll to the bottom of the Components panel on the left and select Adhoc Trend.
Expand the Format section to configure which interface areas are visible and arrange them using drag-and-drop.

Adjust any layout or behavior settings as needed, then click Apply to save the style. See LineChart for details on different settings.
To activate the style, select it from the Component Style dropdown in the floating component panel or the Tools menu.

Interface Areas Overview
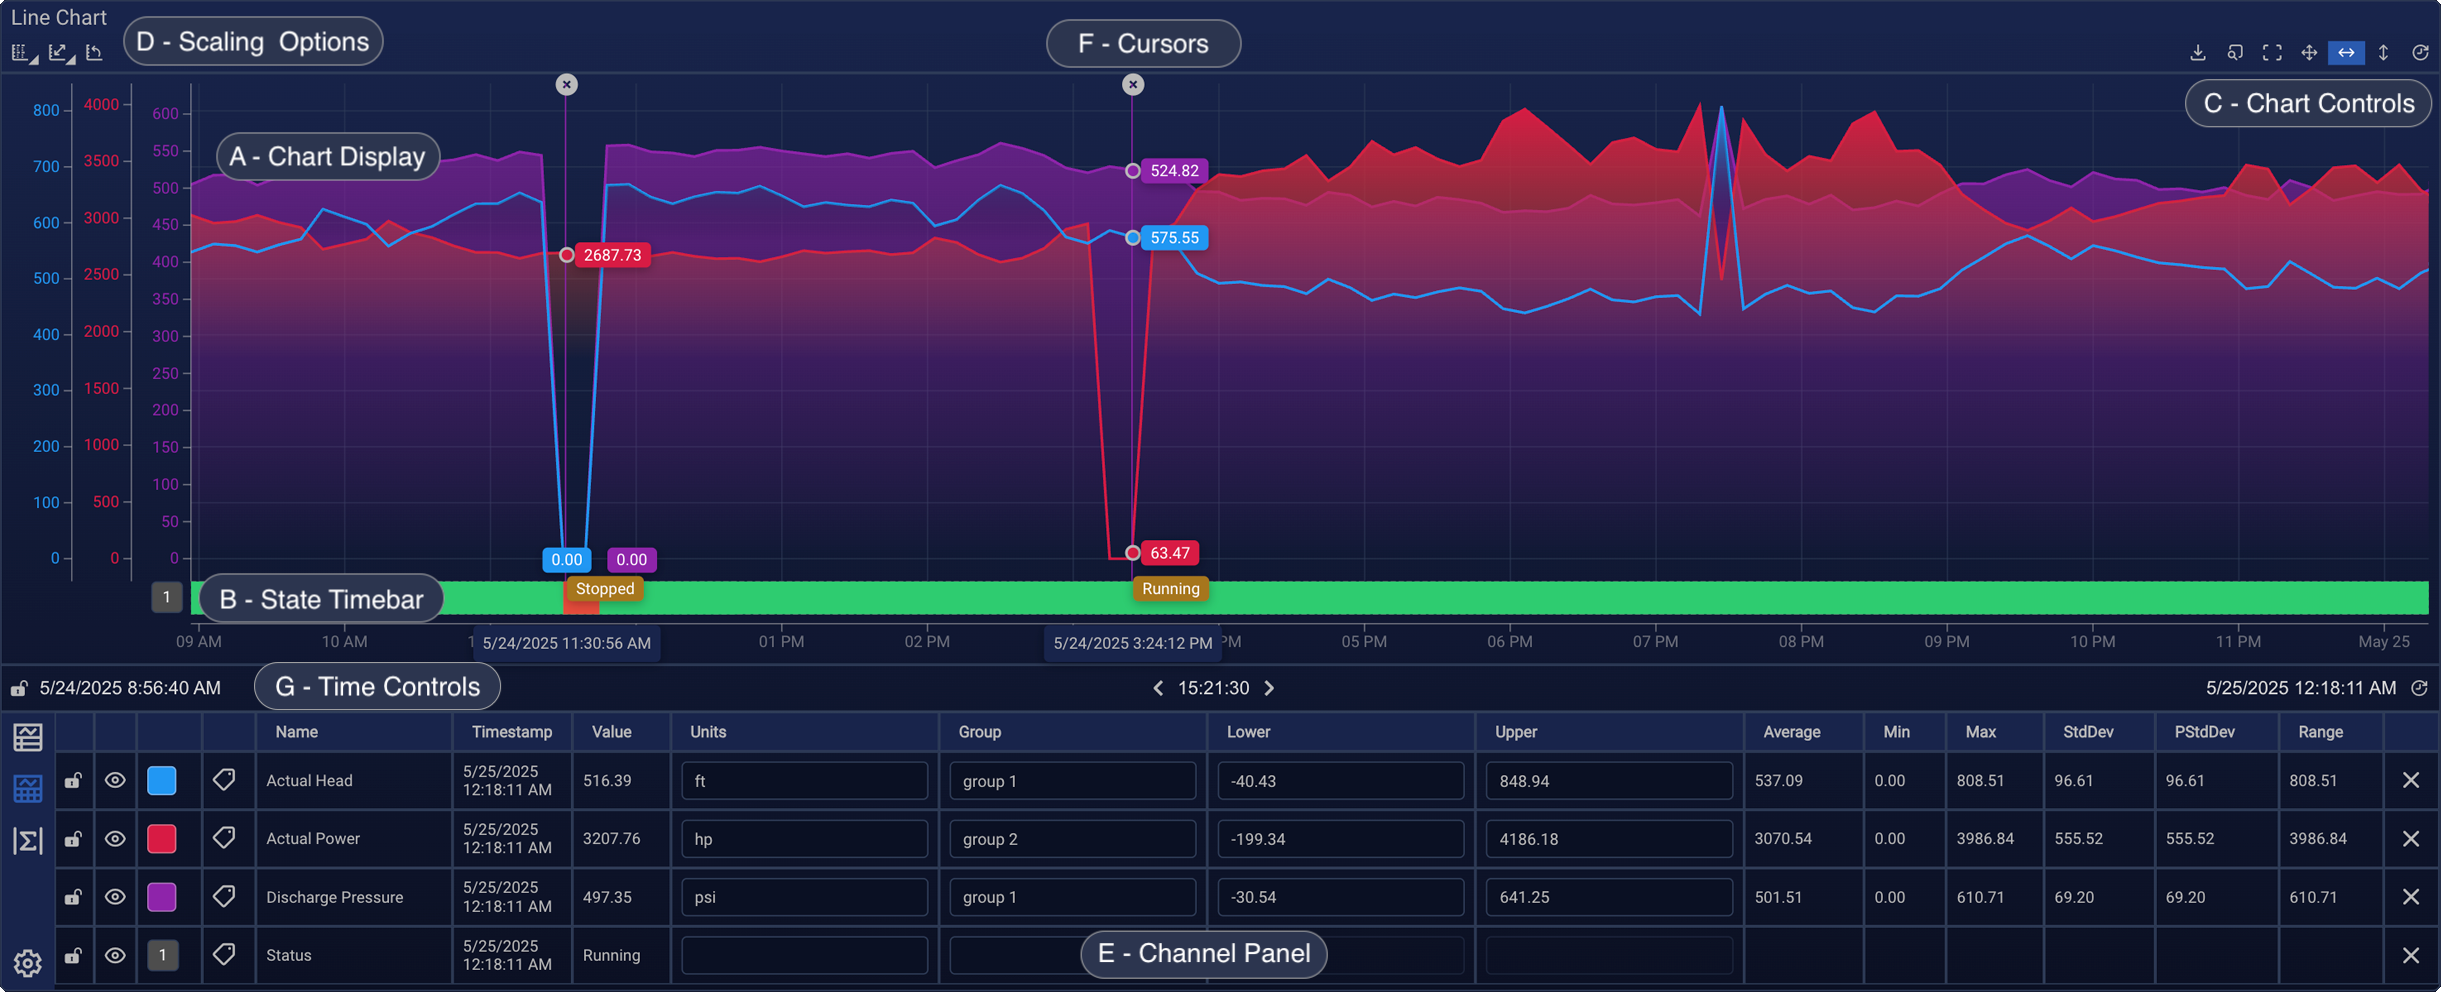
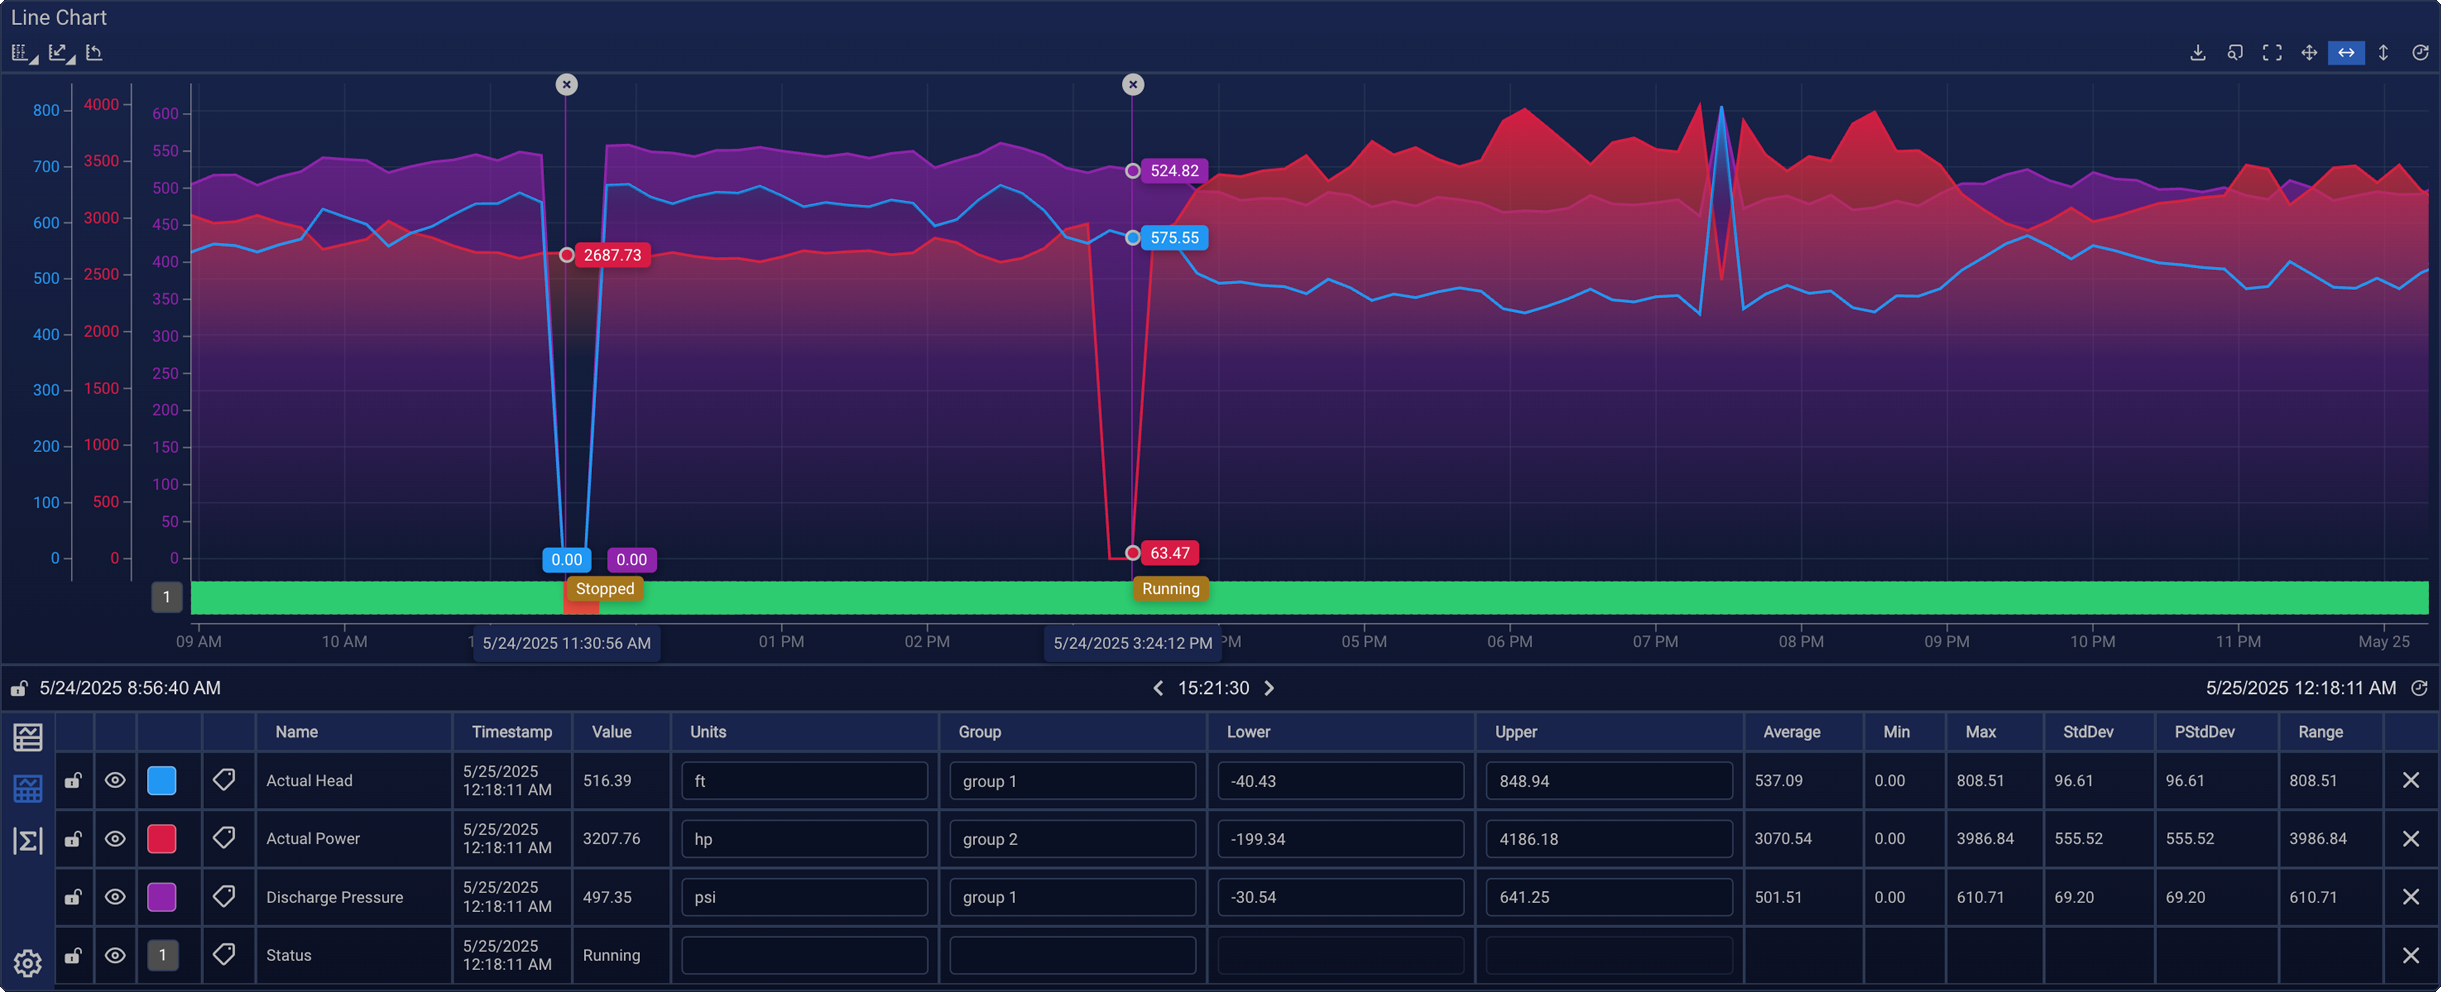
Example Adhoc Trend with all interface areas except legend (your setup may vary based on Component Style).
| Area | Name | Description |
|---|---|---|
| A | Chart Display | Time-series chart for all selected channels |
| B | State Timebars | Visual representation of discrete states |
| C | Chart Controls | Tools for scrolling, zooming, and exporting |
| D | Scaling Options | Scaling, regression lines |
| E | Channel Table | Metadata, statistics and channel configuration settings |
| F | Cursors & Statistics | Cursor markers for value inspection and interval statistics |
| G | Time Controls | Time settings to define start, end, or duration |
In addition to the Channel Table, you can optionally add the Legend area via Component Style. The Legend offers a compact overview with visibility toggles and regression lines configuration.
All interface areas are optional and can be freely added, removed, repositioned, and resized using Component Style.
Chart Display
The main chart area visualizes all selected time-series data channels. By default, users can:
- Drag horizontally to scroll through time
- Scroll or pinch to zoom along the X- or Y-axis
- Hover to display tooltips with timestamp and value
Interaction behavior is consistent with the LineChart component.
Y-axis limits update automatically based on the visible range, zoom level, and the selected Scale Behavior.
Additional navigation options—such as zoom area selection, axis-specific scrolling, and realtime mode—can be accessed via the Chart Controls toolbar in the top-right corner.
State Timebars
State Timebars visualize discrete values—such as equipment states or process phases—as horizontal colored bars below the trend chart.
They provide context alongside continuous signals (e.g., temperature, pressure) by showing transitions such as Running, Stopped, or Error.
Key Behavior
- Supports channels with digital or categorical values
- Each colored segment represents a state and its duration
- Hovering reveals the state name and timestamp
Typical data sources include:
- Tags with digital or binary values
- Attribute values using enumeration-like structures (e.g., PI AF Enumeration Sets)
How to Enable
To display a State Timebar for a channel:
- Open the Channel Table
- Go to the Advanced Section
- Set the Plot Type to
State Timebar
⚠️ The underlying data must support discrete state transitions.
Channel Table
The Channel Table must be added in the Component Style to configure State Timebars.
The Controls Bar is typically positioned above the chart and provides tools for scaling behavior, regression management, and interactive navigation of the chart.
Scaling Options
Scaling Options control how Y-axes are grouped across channels and how their limits are calculated. These tools are especially useful when comparing channels with different units, value ranges, or grouping needs. Additionally you can manage regression lines here.
The scaling toolbar is located in the top-left corner of the Adhoc Trend chart and includes four controls:

| Function | |
|---|---|
| 1 | Scale Mode: Choose how channels share Y-axis scales (Single, Individual, UOM, Group) |
| 2 | Scale Behavior: Auto, Data Source Defined, or Custom Limits |
| 3 | Reset Scale: Resets Y-axis to fit selected scale behavior |
| 4 | Regressions: Opens Regression Configuration window to manage regressions |
Details Scaling Options
1. Scale Mode
This dropdown controls how Y-axis scales are grouped across channels:
| Mode | Description |
|---|---|
| Single | All channels share one Y-axis scale. |
| Individual | Each channel has its own scale. |
| UOM | Channels with the same Unit of Measure (UOM), as defined in the Units column, are grouped onto a shared Y-axis. |
| Group | Channels are grouped manually using the Group field. All channels in the same group share one Y-axis scale. |
Tips
Use Single or UOM when comparing absolute values. Use Individual or Group when channels differ in units or ranges and require separate scaling.
2. Scale Behavior
This dropdown defines how Y-axis limits are determined:
| Mode | Description |
|---|---|
| Auto Scale | Y-axis limits are dynamically adjusted based on the visible data range. Zooming or scrolling updates the axis automatically. |
| Data Source Defined | Uses static min/max values provided by the data source (if available). These appear in the Lower and Upper columns of the Channel Table. |
| Custom Limits | Enables manual control over Y-axis limits per channel or group (depending on the active Scale Mode). Enter values in the Lower and Upper columns and confirm (✓) to switch to Custom Limits. |
See Chart Controls for how interactions like zoom and realtime affect scale behavior.
3. Reset Scale
This icon resets the Y-axis limits based on the selected Scale Behavior:
| Scale Behavior | Reset Behavior |
|---|---|
| Auto Scale | Resets the Y-axis to fit the currently visible data range |
| Data Source Defined | Reapplies the static min/max values provided by the data source |
| Custom Limits | Not applicable — manually defined limits are preserved and not reset automatically |
Chart Controls
The toolbar in the top-right corner of the chart provides tools for navigating, zooming, and exporting data.

| Function | |
|---|---|
| 1. Export CSV | Download visible data as CSV |
| 2. Search Latest | Jump to most recent data |
| 3. Zoom Area | Draw a zoom box for specific time/value ranges |
| 4. Free Scroll | Enable horizontal and vertical scrolling |
| 5. Horizontal Scroll | Time-axis scrolling only |
| 6. Vertical Scroll | Value-axis scrolling only |
| 7. Realtime | Auto-update with incoming data |
You can add or remove these controls as part of your Component Style configuration.
Interaction Behavior
- Scrolling or zooming disables Realtime.
- Using Zoom Area or vertical zoom activates Custom Limits and updates the Lower and Upper fields in the Channel Table.
- Double-clicking reverts the last zoom performed using the Zoom Area tool.
- Enabling Realtime removes any cursor markers.
Legend
The Legend provides a quick overview of the channels displayed in the Adhoc Trend chart. It offers basic controls and metadata for each channel and allows toggling visibility directly from the list.
By default, the Legend includes the following columns:
| Column | Description |
|---|---|
| Lock | Locks the channel’s time position for independent scrolling. |
| Visibility | Toggles whether the channel is shown in the chart. |
| Regression (ŷ) | - For a data channel: Opens the Regression Configuration for that channel. - For a regression entry: Opens the Regression Settings for direct editing. |
| Remove (x) | Removes the channel or regression line from the chart. |
| Name | Displays the tag or attribute name. For regressions, shows equation and R² if enabled. |
| Timestamp | Shows the latest timestamped value. |
| Value | Displays the latest data value. |
| Units (UOM) | Displays the unit of measure. |
Configuring Columns and Customization Options
Through Component Style, you can customize the Legend layout:
- Add the Indicator Color column to customize the color assigned to each channel.
- Transpose the layout to switch between horizontal and vertical alignment (columns vs. rows).
- Hide columns that are not relevant to your workflow.
Below is how these settings appear within the Component Style:


Channel Table
The Channel Table below the chart shows metadata and display settings for each channel.
⚠️ To ensure the Channel Table is available in the Adhoc Trend interface, make sure it is included in the selected Component Style configuration.
The Channel Table is divided into three sections:
- Basic section — Includes metadata columns and display settings
- Advanced section — Contains additional configuration options and styling features
- Statistics section — Appears when cursors are placed to show interval statistics
Use the gear icons  in the lower-left corner of the table to switch between sections and configure which columns are shown.
Basic Section Columns
| Column | Description |
|---|---|
| Lock | Locks the channel’s time position, allowing it to scroll independently for comparison. |
| Visibility | Toggles whether the channel is shown in the chart. |
| Color | Sets the display color for the data channel. By default, Adhoc Trend inherits the color from the channel definition. If multiple channels share the same color, distinct alternatives are automatically applied to ensure clarity in the chart. |
Regression ŷ | - For a data channel: Opens the Regression Configuration for that channel. - For a regression entry: Opens the Regression Settings for direct editing. |
| Data Type | Shows the source-defined type of data (e.g., tag, enumeration). |
| Name | Displays the tag or attribute name from the data source. For regression channels, displays the equation and R² value if enabled in the regression settings. |
| Timestamp | Shows the most recent timestamped value or, when hovering, the value at the cursor position. |
| Value | Shows the latest data value or the value under the hovered timestamp. |
| Units | Displays the Unit of Measure (UOM), if available. Used for UOM-based scaling. Can be edited manually. |
| Group | Assigns a group label to the channel. When Group scale mode is active, channels with the same label share a Y-axis. Can use string or numeric values. |
| Lower | Displays the lower Y-axis limit. Value depends on the active Scale Behavior. When manually edited and confirmed (✓), switches to Custom Limits. |
| Upper | Same as Lower, but for the upper Y-axis. |
Remove x | Removes the channel from the trend chart. |
Advanced Section Columns
The Advanced Section provides optional styling and statistical details for each channel.:
Descriptive statistics:
- Minimum, Maximum, Average, Standard Deviation, and Population Standard Deviation
- Calculated based on the visible time range in the chart
Plot Type selection:
- Choose how the channel is visualized (e.g., Line, Bar, Step, Step After, Step Before, Annotation)
- For channels with discrete states, you can also select State Timebar
Statistics Section
The Statistics section displays statistical information when at least two cursors are placed on the chart.
It provides statistical insights about the time range between the markers for the channels on the adhoc chart.
Available statistics include: Minimum, Maximum, Average, Delta
⚠️ Statistics are only shown if supported by the data source (e.g., PI System).
Channel Table Configuration
You can configure which columns are shown in each section of the Channel Table.
- Click the gear icon  in the lower-left corner of the table
- Select which columns to display for each section using the Columns Configuration dialog

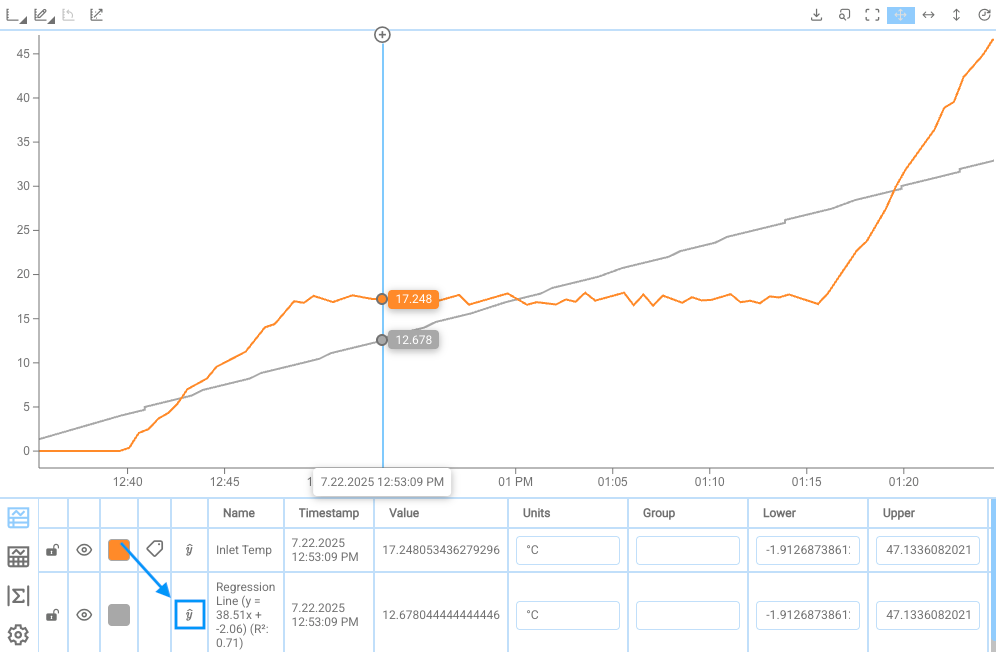
Regression Lines
The Regression Lines feature allows you to overlay calculated regression lines on selected data channels within the Adhoc Trend. This enables quick visual analysis of trends, correlations, and deviations over time.
Note
Regression line calculations do not need to be supported by the source system.
Adding a Regression
Open Regressions Configuration window via:
- Controls Bar - opens all regressions for the current Adhoc Trend
- Channel Table (ŷ) - opens regression for selected channel

In the regression configuration window select the channel for which the regression will be calculated.
Click the + icon in the top-left corner to create a new regression.
A detailed configuration dialog opens for defining the regression properties.
Configuration Options
The following options are available when defining a regression:

| Field | Description |
|---|---|
| Name | User-defined name for the regression, shown in the Name column of the Channel Table. |
| Indicator Color | Color of the regression line. |
| Shade Color | Optional shading below the regression line. |
| Show Equation | Displays the regression formula in the Name column of the Channel Table. |
| Show R² | Displays the R² value in the Name column of the Channel Table. |
| Regression Type | Type of regression (Linear, Exponential, Logarithmic, Power, Polynomial, Min, Max, Custom). |
| Source Channel | Channel on which the regression is calculated. |
| UOM | Unit of measure for display purposes. |
| LOW / UPPER | Defines fixed Y-axis limits for the regression. |
| Number Format | Defines how numeric values are displayed (%, scientific, decimal places, etc.). If Display Digits is selected, the number of displayed decimals is defined in the Display Digits field. |
| Display Digits | Defines the number of decimal places displayed. Only applies if Display Digits is selected in Number Format (see details below). |
| Line Dasharray | Selects line style (solid, dashed, etc.). |
| Thickness | Defines line thickness in pixels. |
| Group | Grouping label for Y-axis scaling (optional). |
| Precision | Defines calculation precision (rounding behavior) for the regression. |
| Order | Defines the order of the polynomial where applicable. |
| Formula | Editable formula field. Automatically populated but can be modified manually. |
Details on Number Format
The Number Format field controls how numbers are displayed for the regression line:
| Option | Description |
|---|---|
| System | Uses the numeric formatting defined by the user's operating system settings (e.g., decimal separator). |
| Channel | Inherits the formatting from the source channel configuration—either from the connected data source or manually set in the channel’s attribute mapping. |
| Display Digits | Allows explicit definition of the number of decimal places shown. |
| Scientific | Displays values in scientific notation (e.g., 1.23E+03). |
| Percentage | Displays values as percentages. |
When Display Digits is selected, you can define how many decimal places are shown.
For example:
1→12.32→12.343→12.345
This affects display only and does not impact underlying data or calculations.
Click Apply to confirm and add the regression. The regression line will now appear on the chart and is listed as an additional row beneath the source channel in the Channel Table.
Managing Regressions
There are two ways to manage regressions in Adhoc Trend:
Adhoc Trend Overview:
Click the Regressions icon in the Controls Bar to open the Regressions Configuration window. This lists all regressions for the current Adhoc Trend.Channel-Specific Overview:
In the Channel Table or Legend, click the ŷ icon next to a data channel to open all regressions for that channel only.
From either window, you can:
- Add, edit, or delete regressions.
- Confirm changes with Apply.

Editing a Specific Regression
To edit a single regression directly:
- Click the ŷ icon next to the regression in the Channel Table or Legend.
This opens the detailed Regression Settings dialog (see Configuration Options).
Access Summary
- Controls Bar: All regressions for the Adhoc Trend
- Channel Table / Legend ŷ (channel): Regressions for that channel
- Channel Table / Legend ŷ (regression): Edit specific regression settings directly
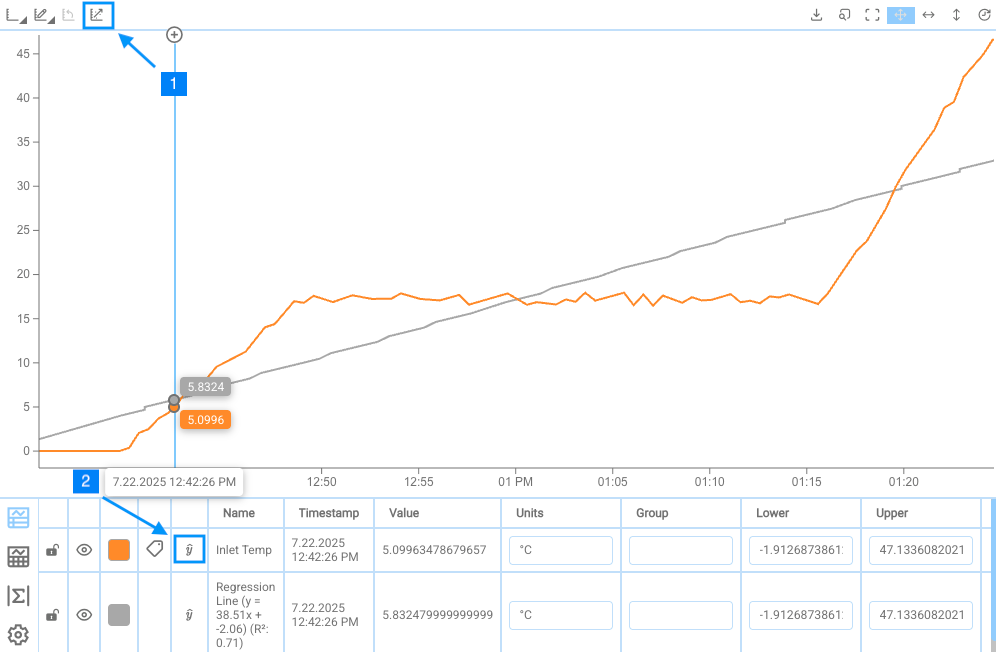
Cursors and Statistics
Cursors can be used to inspect and compare values across a time range.
- Click the + icon on a tooltip to add a cursor
- Click the x icon on a cursor to remove it
The tooltips display the value of the data channel at that point in time.
When two or more cursors are placed, statistical information is displayed in the Statistics Section [Σ]. It shows calculated values - such as: average, minimum, maximum, and delta - based on the time range between the cursors.
⚠️ Statistics are only shown if supported by the data source (e.g., PI System).
Interaction Behavior
⚠️ Enabling Realtime removes any placed cursors.
Time Controls
The Time Controls below the chart allow you to define a fixed time window for analysis.
You can configure the visible time range using:
- Start Time and End Time pickers
- A Duration field to define the time span
- Arrow buttons (
<,>) to shift the entire window forward or backward by the selected duration
These controls work the same way as in the LineChart.
Behavior Notes
- Adhoc Trends persist across views, allowing cross-view comparisons, but they close when the browser is refreshed
- State Timebars and statistics are only shown if the underlying data source supports them
- Multiple Adhoc Trends can be open simultaneously in separate overlays or windows
Add Adhoc Trend Features to a LineChart
To use Adhoc Trend-like functionality in a standard LineChart component, you have two options:
Option 1: Define a reusable Component Style
Follow the steps in Component Style to configure the layout. Add the Channel Table, Chart Controls, and other interface areas, then apply the style to your LineChart.
This method allows consistent reuse across multiple components.
Option 2: Configure an individual LineChart manually
To enable core features in a specific LineChart:
Add the Channel Table
- In the Settings of the LineChart component, go to the Format section.
- In the Chart Layout, drag and drop the
Tableelement to add the Channel Table.
Enable Cursors
- In the Scales / Cursors section, enable the
Cursortoggle.
- In the Scales / Cursors section, enable the
For more details on component behavior, see the LineChart documentation.