On first login you are greeted with an empty dashboard screen where you can immediately start working. The entire area is split into the following sections:
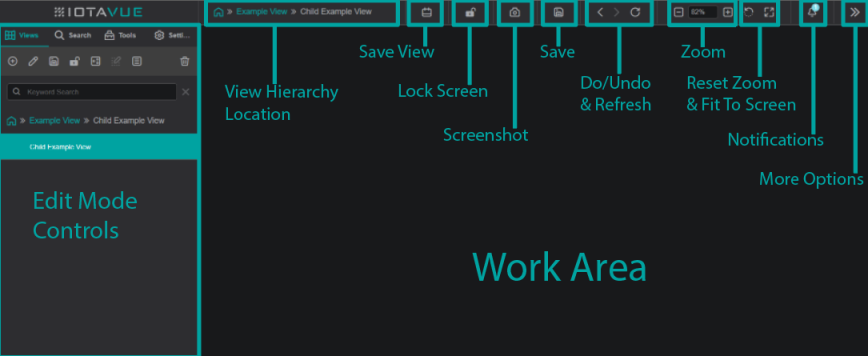
- Main work area which is used for building dashboards. The work area is split into two main components: the interior work space, and the exterior workspace.
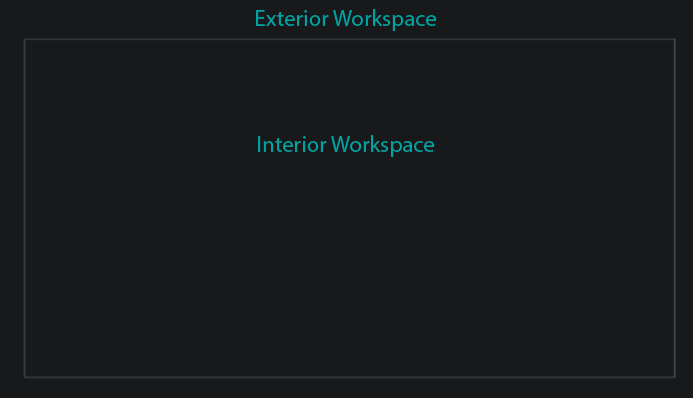
The interior workspace governs the bounds of what will become visible to the viewer when screen lock
 is selected at the top of the screen.
The bounds of the interior workspace can be defined when creating a new page, or altered within an already created page.
This is done by selecting the edit icon
 within the Views tab
  , then selecting background.
- It is best practice to match the dimensions of the workspace with the intended display dimensions.
Controls are split into 4 categories:
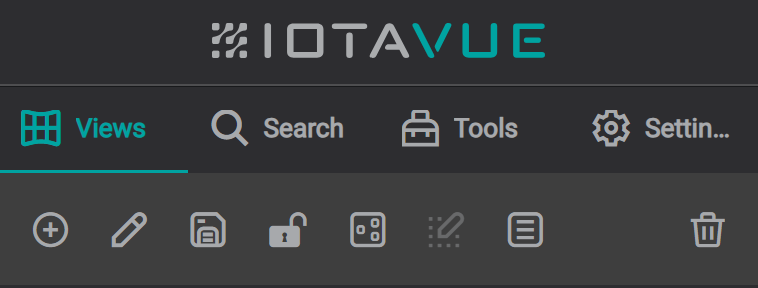
Views
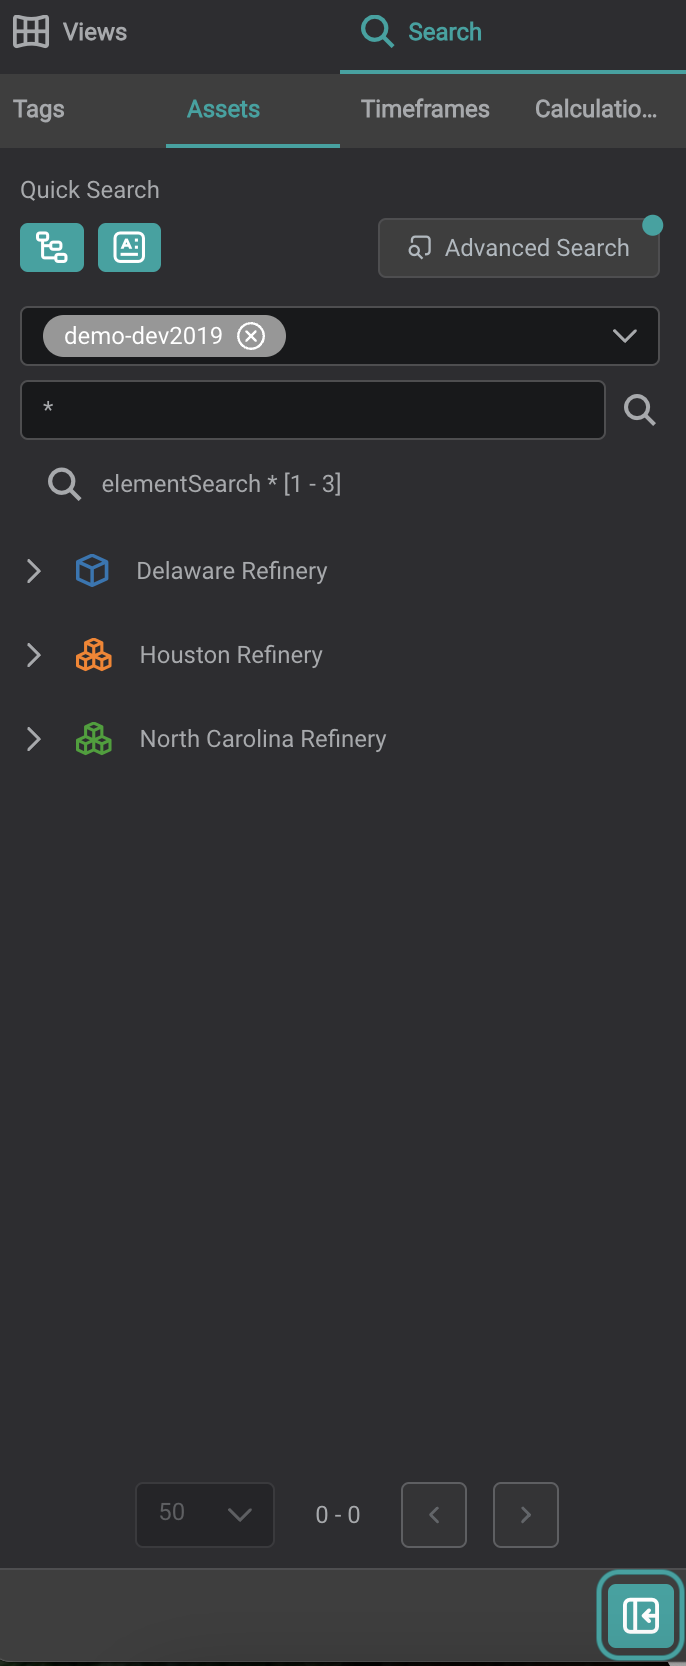
: Viewsare where one can create, manage, and share all workspace views.Search
 : Within
 Search, one can navigate to their desired data sources includingTags,Assets, andTimeframes.Tools
 :
: Toolscontain all the necessary materials for propagating and stylizing your workspace view.Settings
 :
: Settingsallow you to alter how information is visualized. Size, orientation, coloration, and attribute mapping among many other properties can be altered to any preference.
The sidebar can be collapsed by clicking the collapse button located in the bottom-right corner:

This is where workspace options are present to save, lock, and capture your current view, do and undo actions, zoom in and out within the view, and switch between full-screen and edit mode.
The top right
 dropdown offers more options to manage data sources, drivers, and user preferences, as well as navigate to the XR editor and links to this documentation.
1. Creating A New View
To get started, in the ![]() Views tab press the
Views tab press the ![]() button and provide a name for your new View.
button and provide a name for your new View.
Press the Apply button to confirm view creation.
On the sidebar you will notice that your new view was created.
You can now edit it further through the ![]() button, customizing the background and viewspace to your liking.
button, customizing the background and viewspace to your liking.

Want to See What Else You Can Do Within Views?
For further details about Views management see Views section.
2. Adding Components
Components are the different methods used in visualizing data. They can be located within the Tools tab ![]()
When building views, it can be helpful to pop out the components to have them always accessible by dragging the drag-out symbol in the workspace. Resizing can be performed by holding the bottom right corner of any popout menu.
To place a component onto a working view area you can choose one of the following approaches:
Simply drag the component (Line Chart in our example) directly onto the work area. Drag and hold to relocate as needed.


Select the quick component (Line Chart in our example) to highlight it.
Now click on the work area where you want the top left corner of the component to begin and drag/resize the component as needed.
Press on the quick component again to unselect it.


First highlight the component you wish to use then navigate to Tags located within the ![]() Search tab.
Search tab.
In the search input field, locate the tag you wish to use and drag it into the workspace area.


Need Help Deciding Which Component to Use?
- Check out all available components to see which fits your visualization needs best
- Don't forget, you can build your own Custom Components!
3. Assigning Data to Components
To assign data to an empty component, navigate to the ![]() Search tab and search for the desired tag name. After locating your tag, simply drag it onto the component:
Search tab and search for the desired tag name. After locating your tag, simply drag it onto the component:
Having Difficulty Finding Your Data?
Checkout out the Search section for advanced details on tags, timeframes and asset searches.
What Next?
- Checkout our video tutorials to explore basic usage examples.
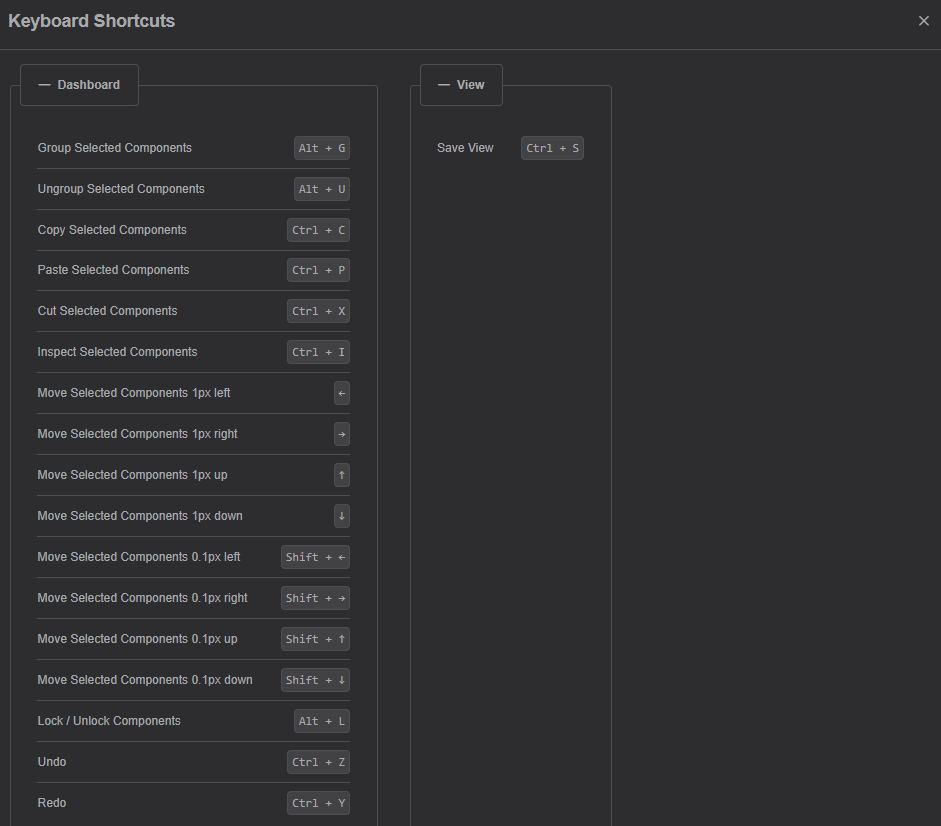
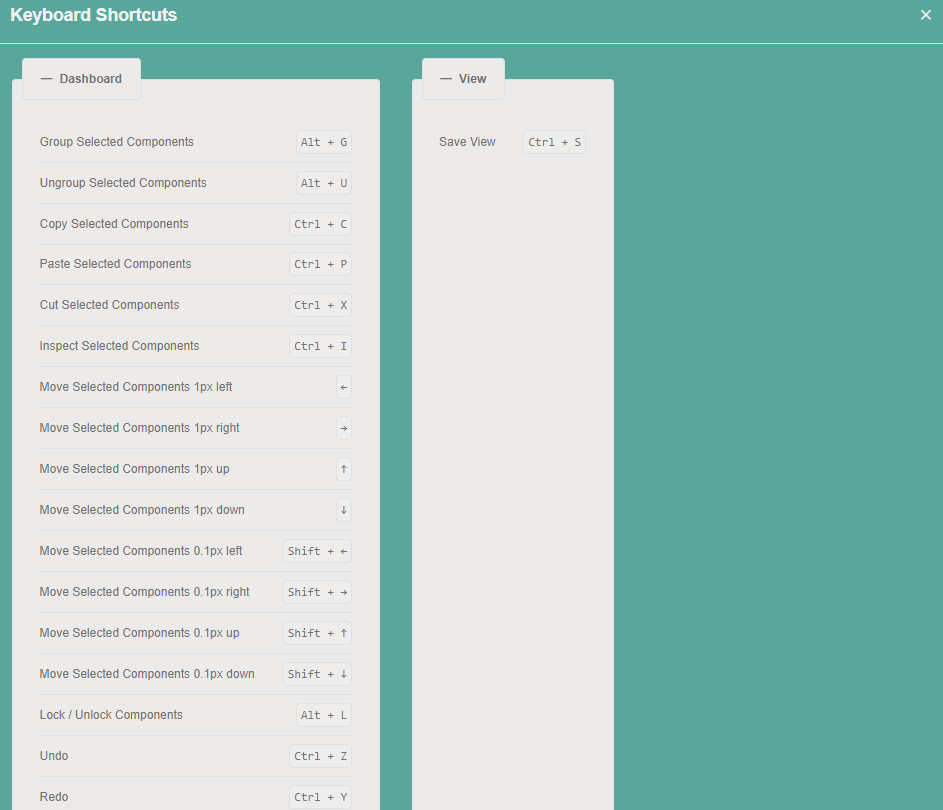
- We also support a standard set of key shortcuts. List of available keybindings can be referenced in
Left Alt + ?.