
Logs
Logs
Logs is where you find out what a run actually did. When a task reports Error,
or succeeds but writes nothing, the explanation is here.
Open Logs from the Stream menu.
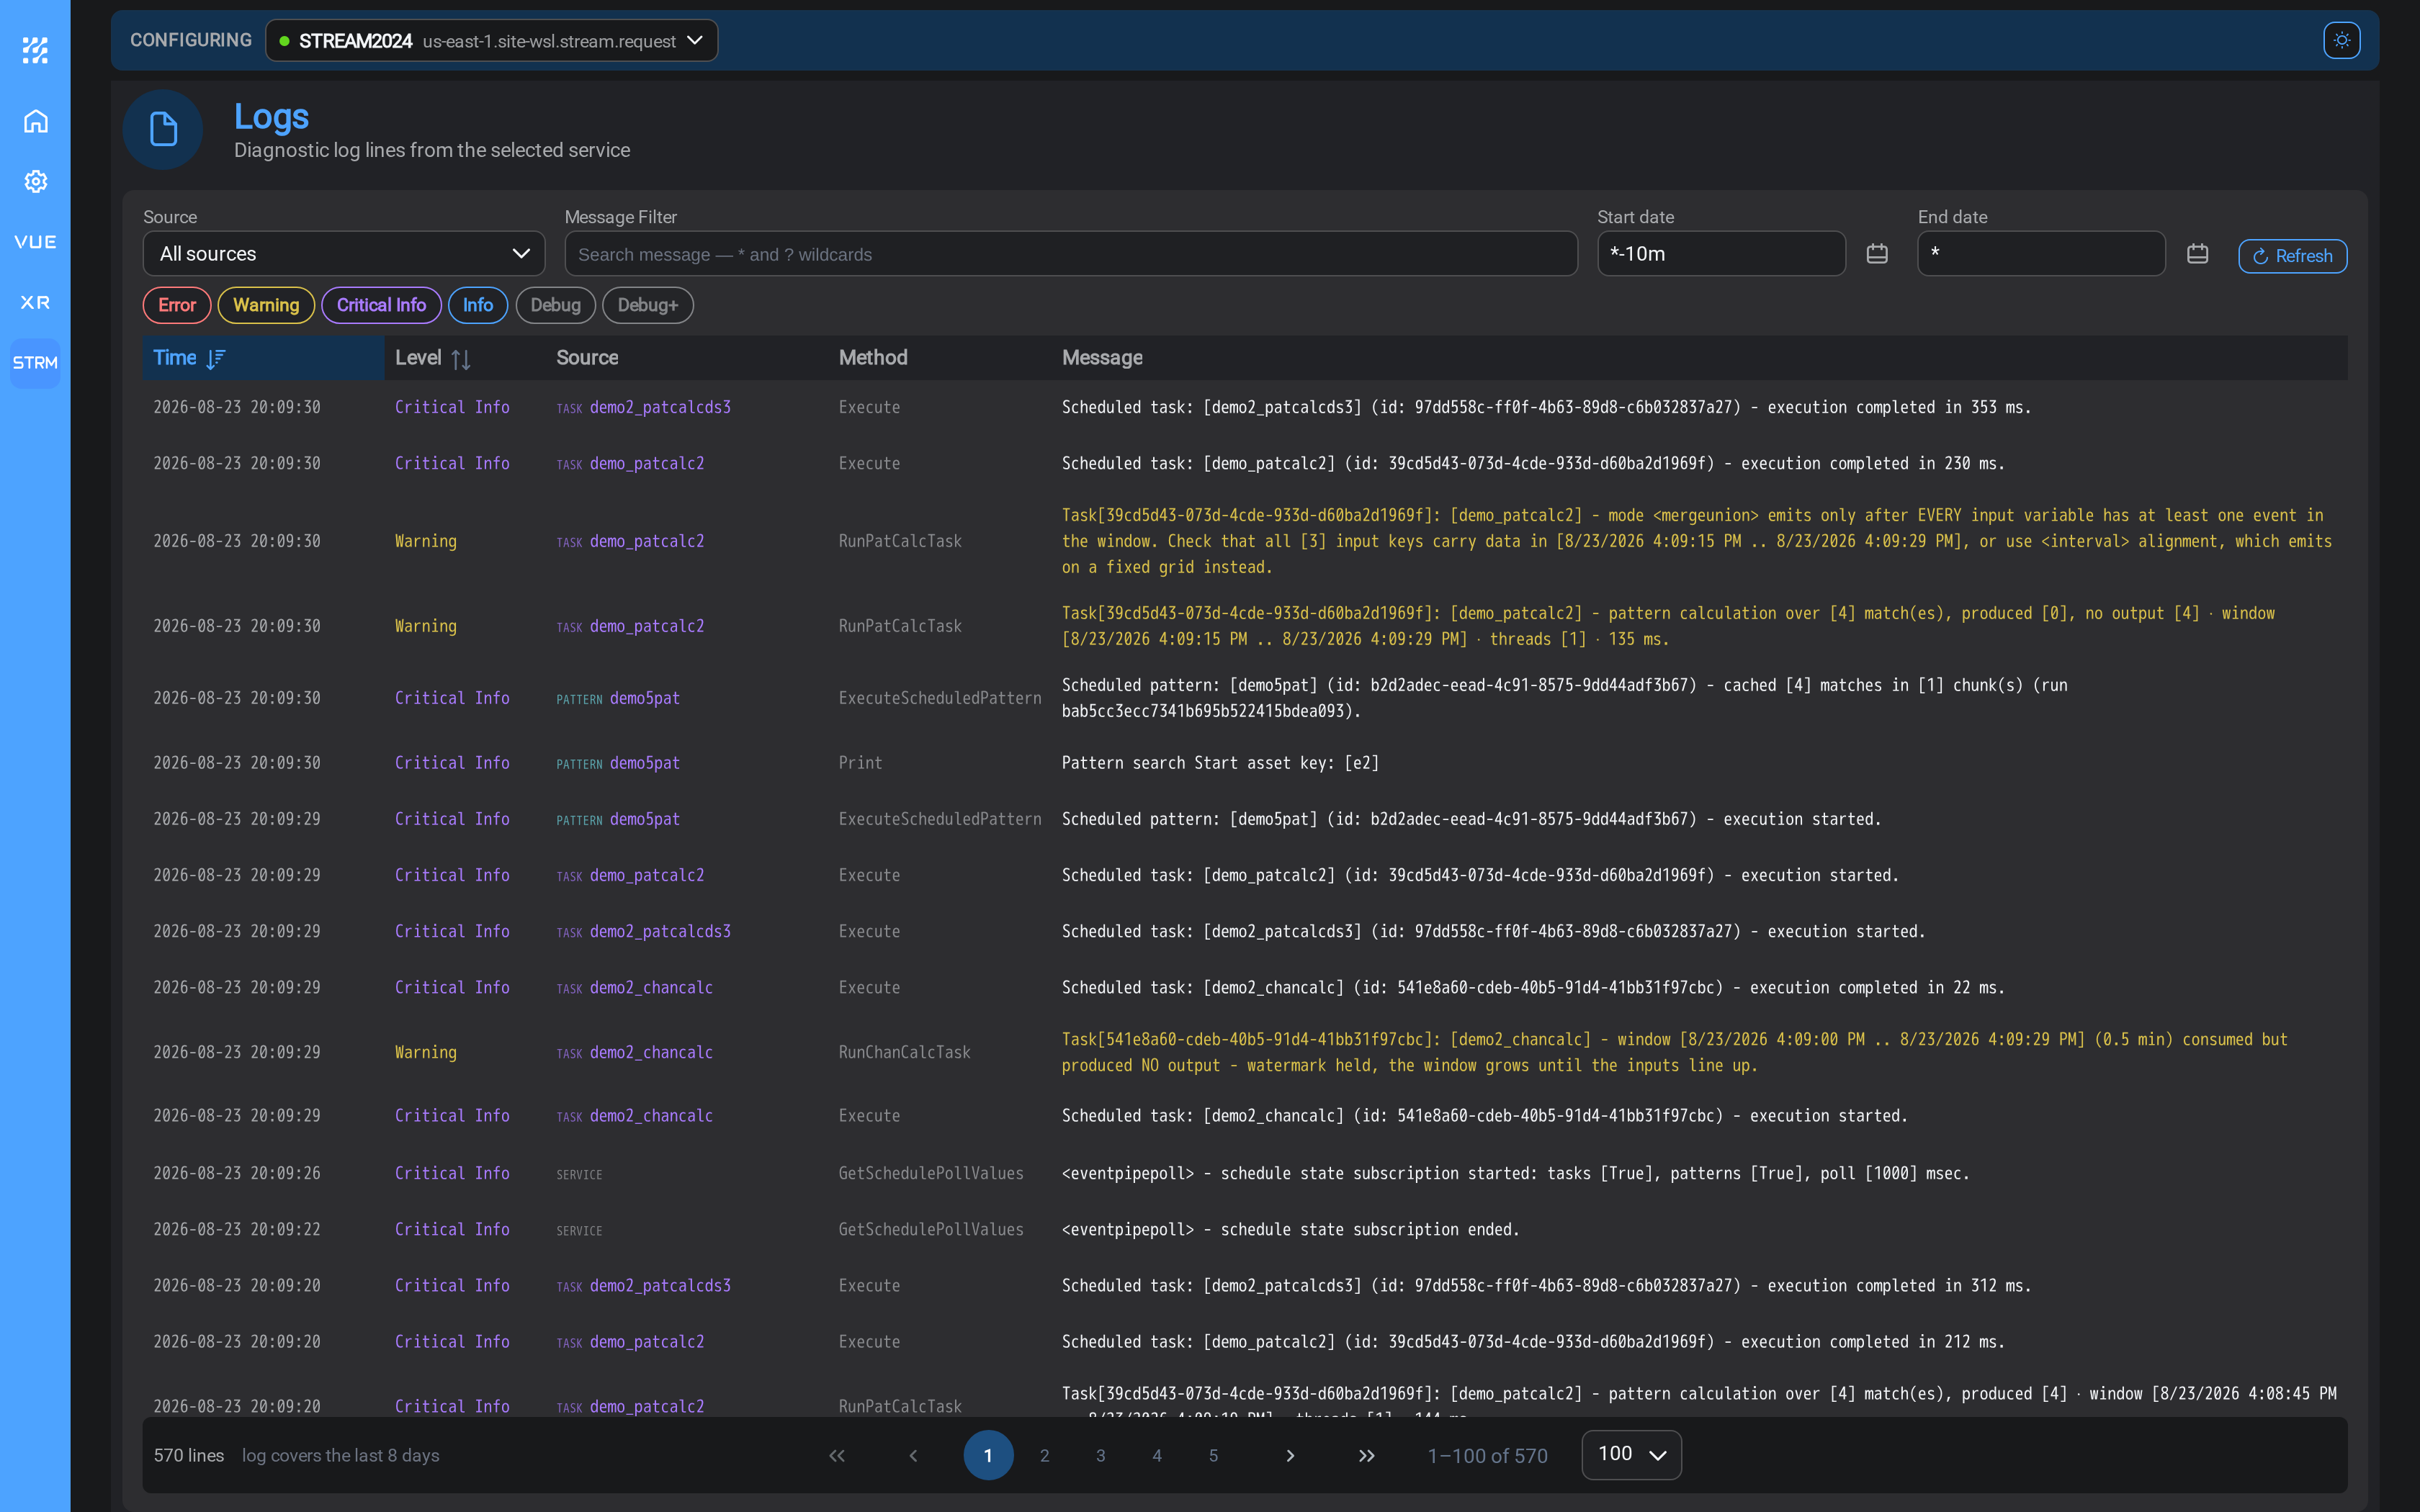
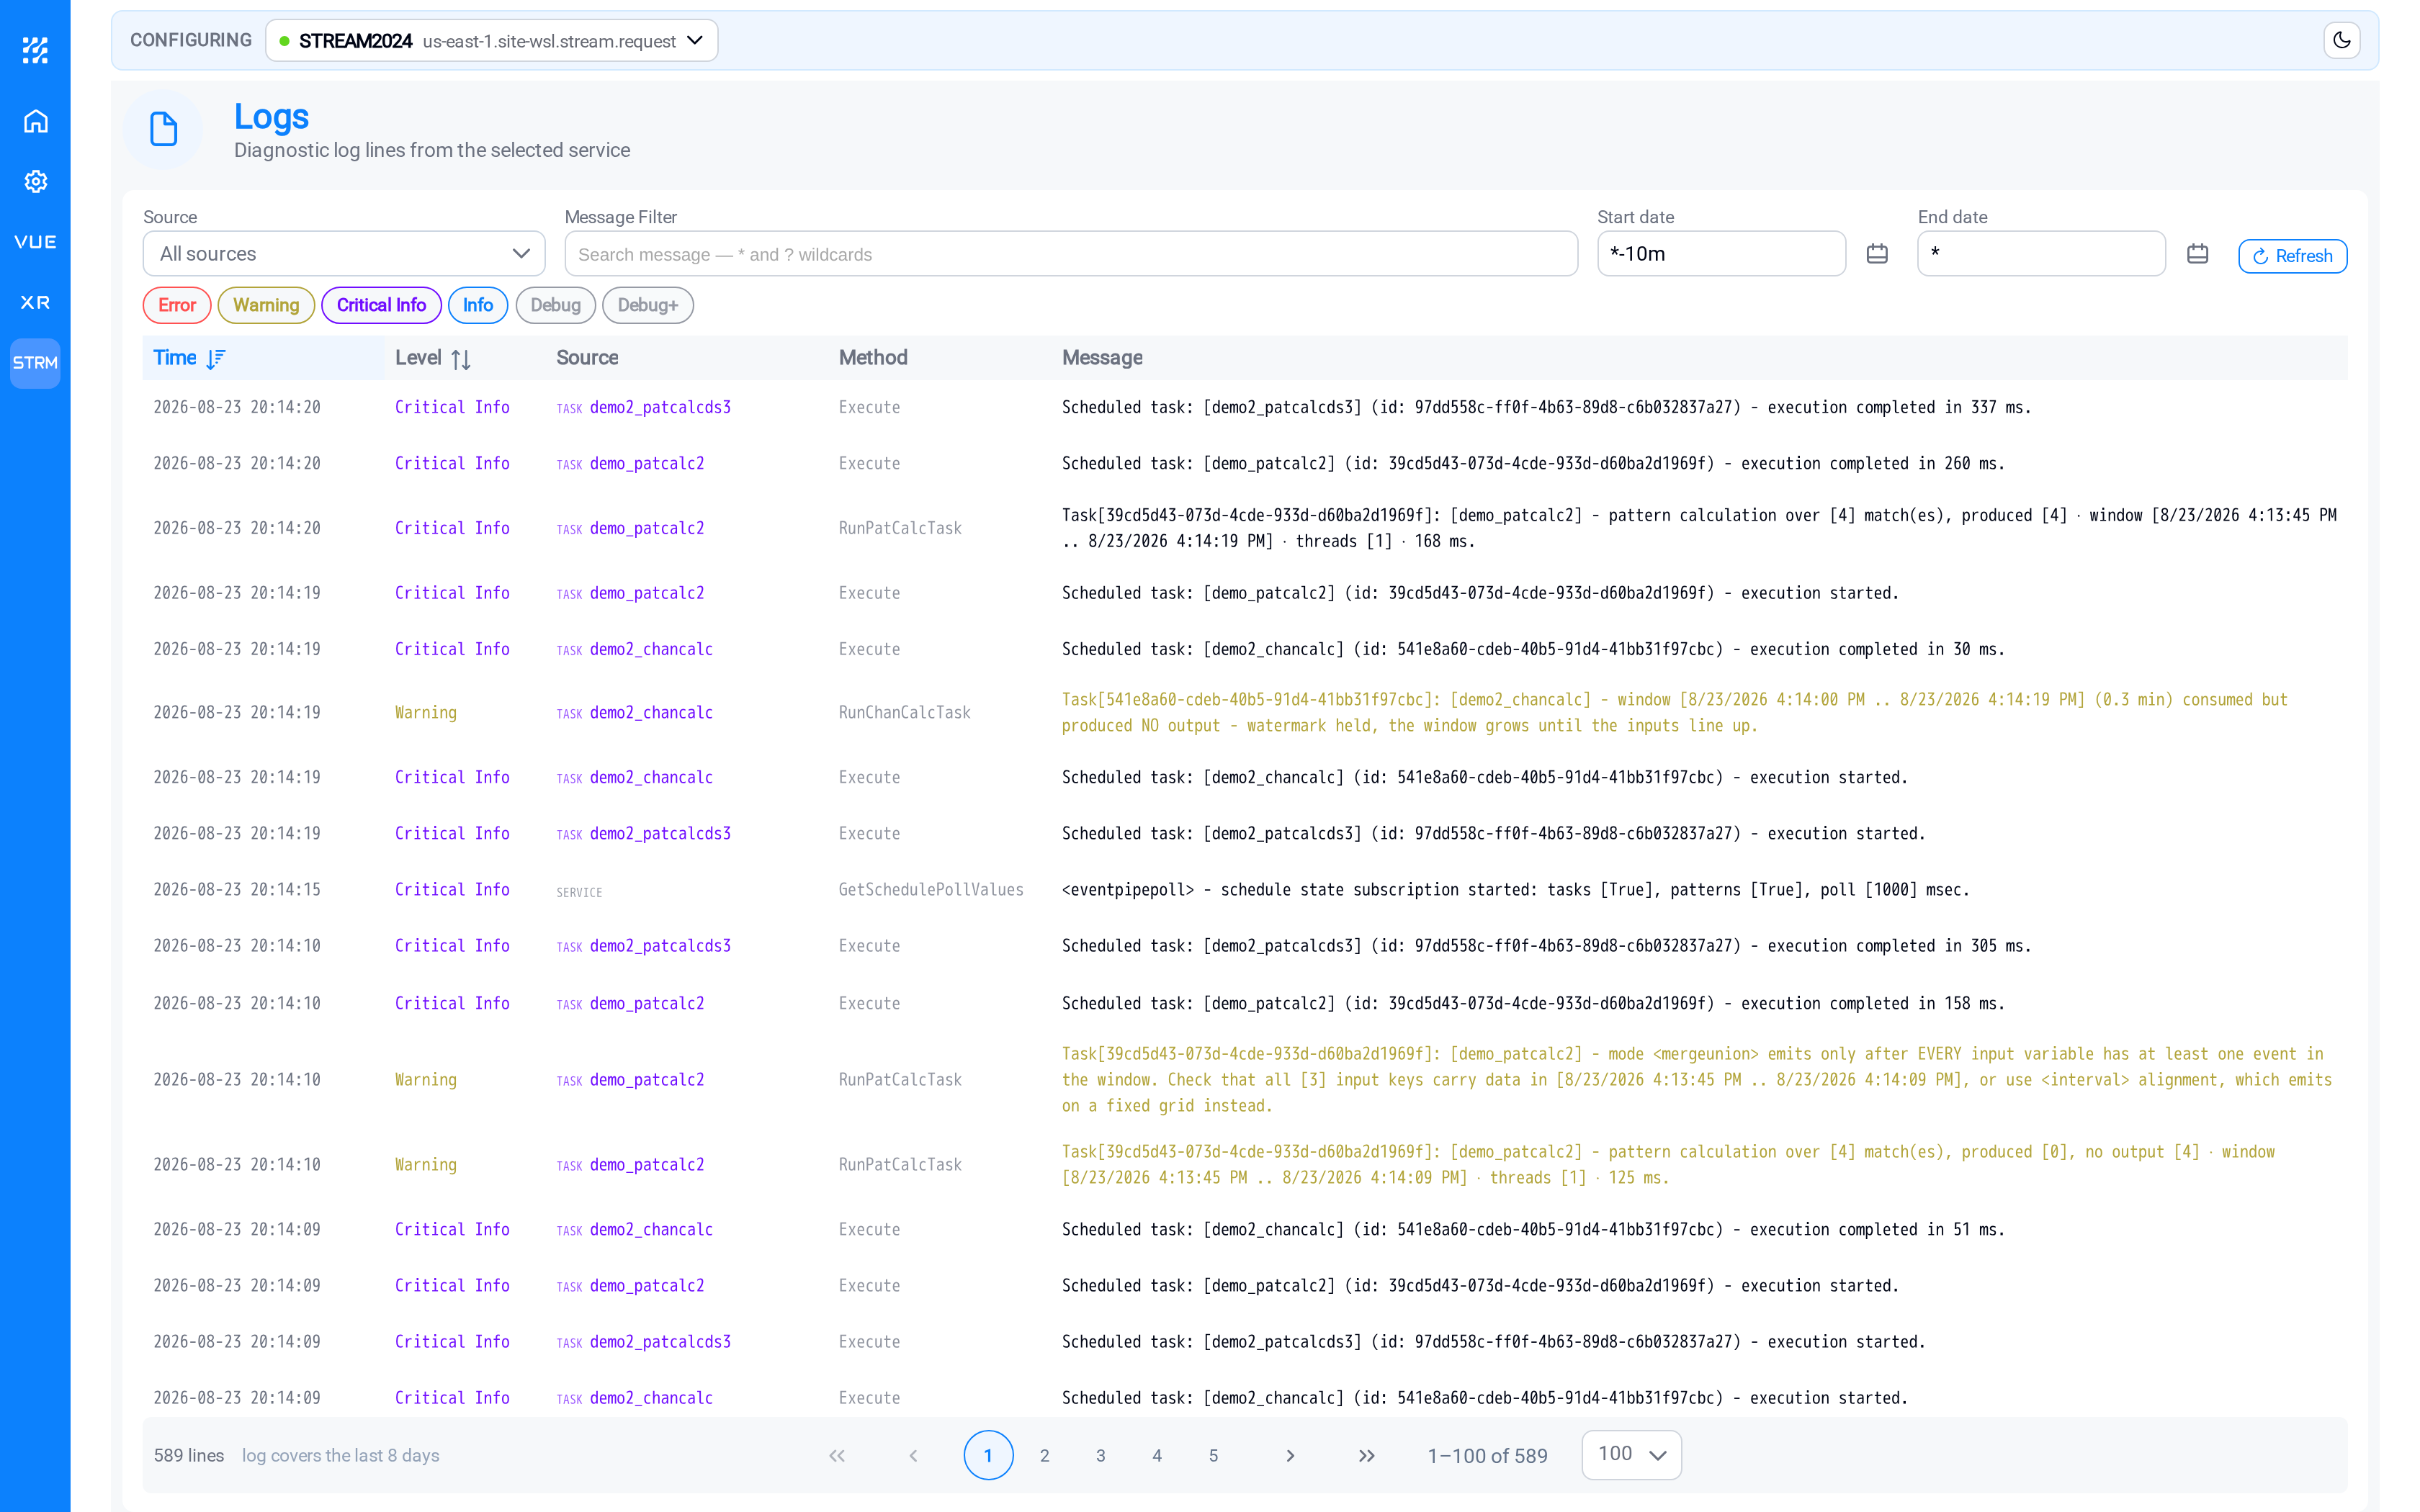
The filters along the top are the page. The list underneath is normally far too long
to read, so the skill is in narrowing it: the header and column headings stay put
while the rows scroll.
Narrow it down
| Filter | Use it to |
|---|---|
| Level | Show only errors, or include warnings and informational messages |
| Time window | Restrict to when the problem happened |
| Source | Restrict to one task or one pattern |
| Search | Find a message containing particular text |
Logs opens on a recent window rather than the whole history, so if you are
looking into something from yesterday, widen the window before concluding there is
nothing there. The page tells you what period it is currently covering.
The order that works
- Set the time window around when the problem happened.
- Set Source to the task you are investigating.
- Set Level to errors only.
If that comes back empty, work backwards: relax the level to include warnings, then
widen the window. An empty result at every level usually means the task did not run
at all; check its schedule rather than its logs.
Reading the levels
| Level | What it means for you |
|---|---|
| Error | The run failed, or part of it did. Start here. |
| Warning | The run continued but something was not right: a value it could not read, a match it could not resolve. |
| Information | Normal progress. Useful for confirming a run happened at all. |
Warnings deserve more attention than they usually get. A task that logs the same
warning on every run for a month is a task quietly doing less than you think:
typically skipping assets whose attribute is missing, while succeeding overall.
Arriving here from somewhere else
You will often reach Logs by drilling in from another page rather than by opening
it directly:
- From Task Schedules, double-clicking a point on an expanded row's trend
- From Tasks or Patterns, using the logs control in the row's Actions
When you arrive this way, the filters are already set to what you clicked, and a
Back to… button appears in the page header. Use it rather than the browser's
back button: it returns you to the page you came from in the state you left it:
the same page of the list, with the same row still expanded and the same time range
on the trend.
Working out what went wrong
"No matches" or an empty run.
The task ran and its source produced nothing. Check the pattern's Preview tab. If
the pattern previews correctly but the task still finds nothing, and the pattern is
cached, the cache is probably older than your last pattern edit: rebuild it.
A connection or authentication message.
The endpoint is the problem, not the task. Go to Endpoints, test the
connection, and check the account. A host that cannot be resolved and a host that
rejects the credentials both surface here, and the message distinguishes them.
A message about a value or a type.
Something the calculation read was not what it expected: commonly an attribute that
is missing on some assets but not others, or a value arriving as text where a number
was wanted. If a pattern matches 400 assets and 3 of them are missing an attribute,
this is what you see: a task that mostly works.
A destination or write message.
The task computed its result and could not deliver it. For a file destination, the
folder or its permissions; for SQL, the table, its columns, or the account's rights
to write to it.
Nothing at all, at any level.
The task did not run. Its schedule is the place to look: it may be Paused, or the
task may never have been scheduled at all. The Tasks page's Unscheduled filter
answers that in one click.
What's Next
Logs tell you what the software did. When the question is what a person did:
who changed this task, and to what: continue to Audit →.
Related
- Task Scheduler: whether the task ran when you expected
- Endpoints: testing a connection a log message points at
- Audit: configuration changes rather than run history