
Task Scheduler
Task Scheduler
A task describes work. A schedule makes it happen. Until a task has a schedule it
sits on the Tasks page marked Unscheduled and never runs, however correctly it
is configured.
Open Task Schedules from the Stream menu.
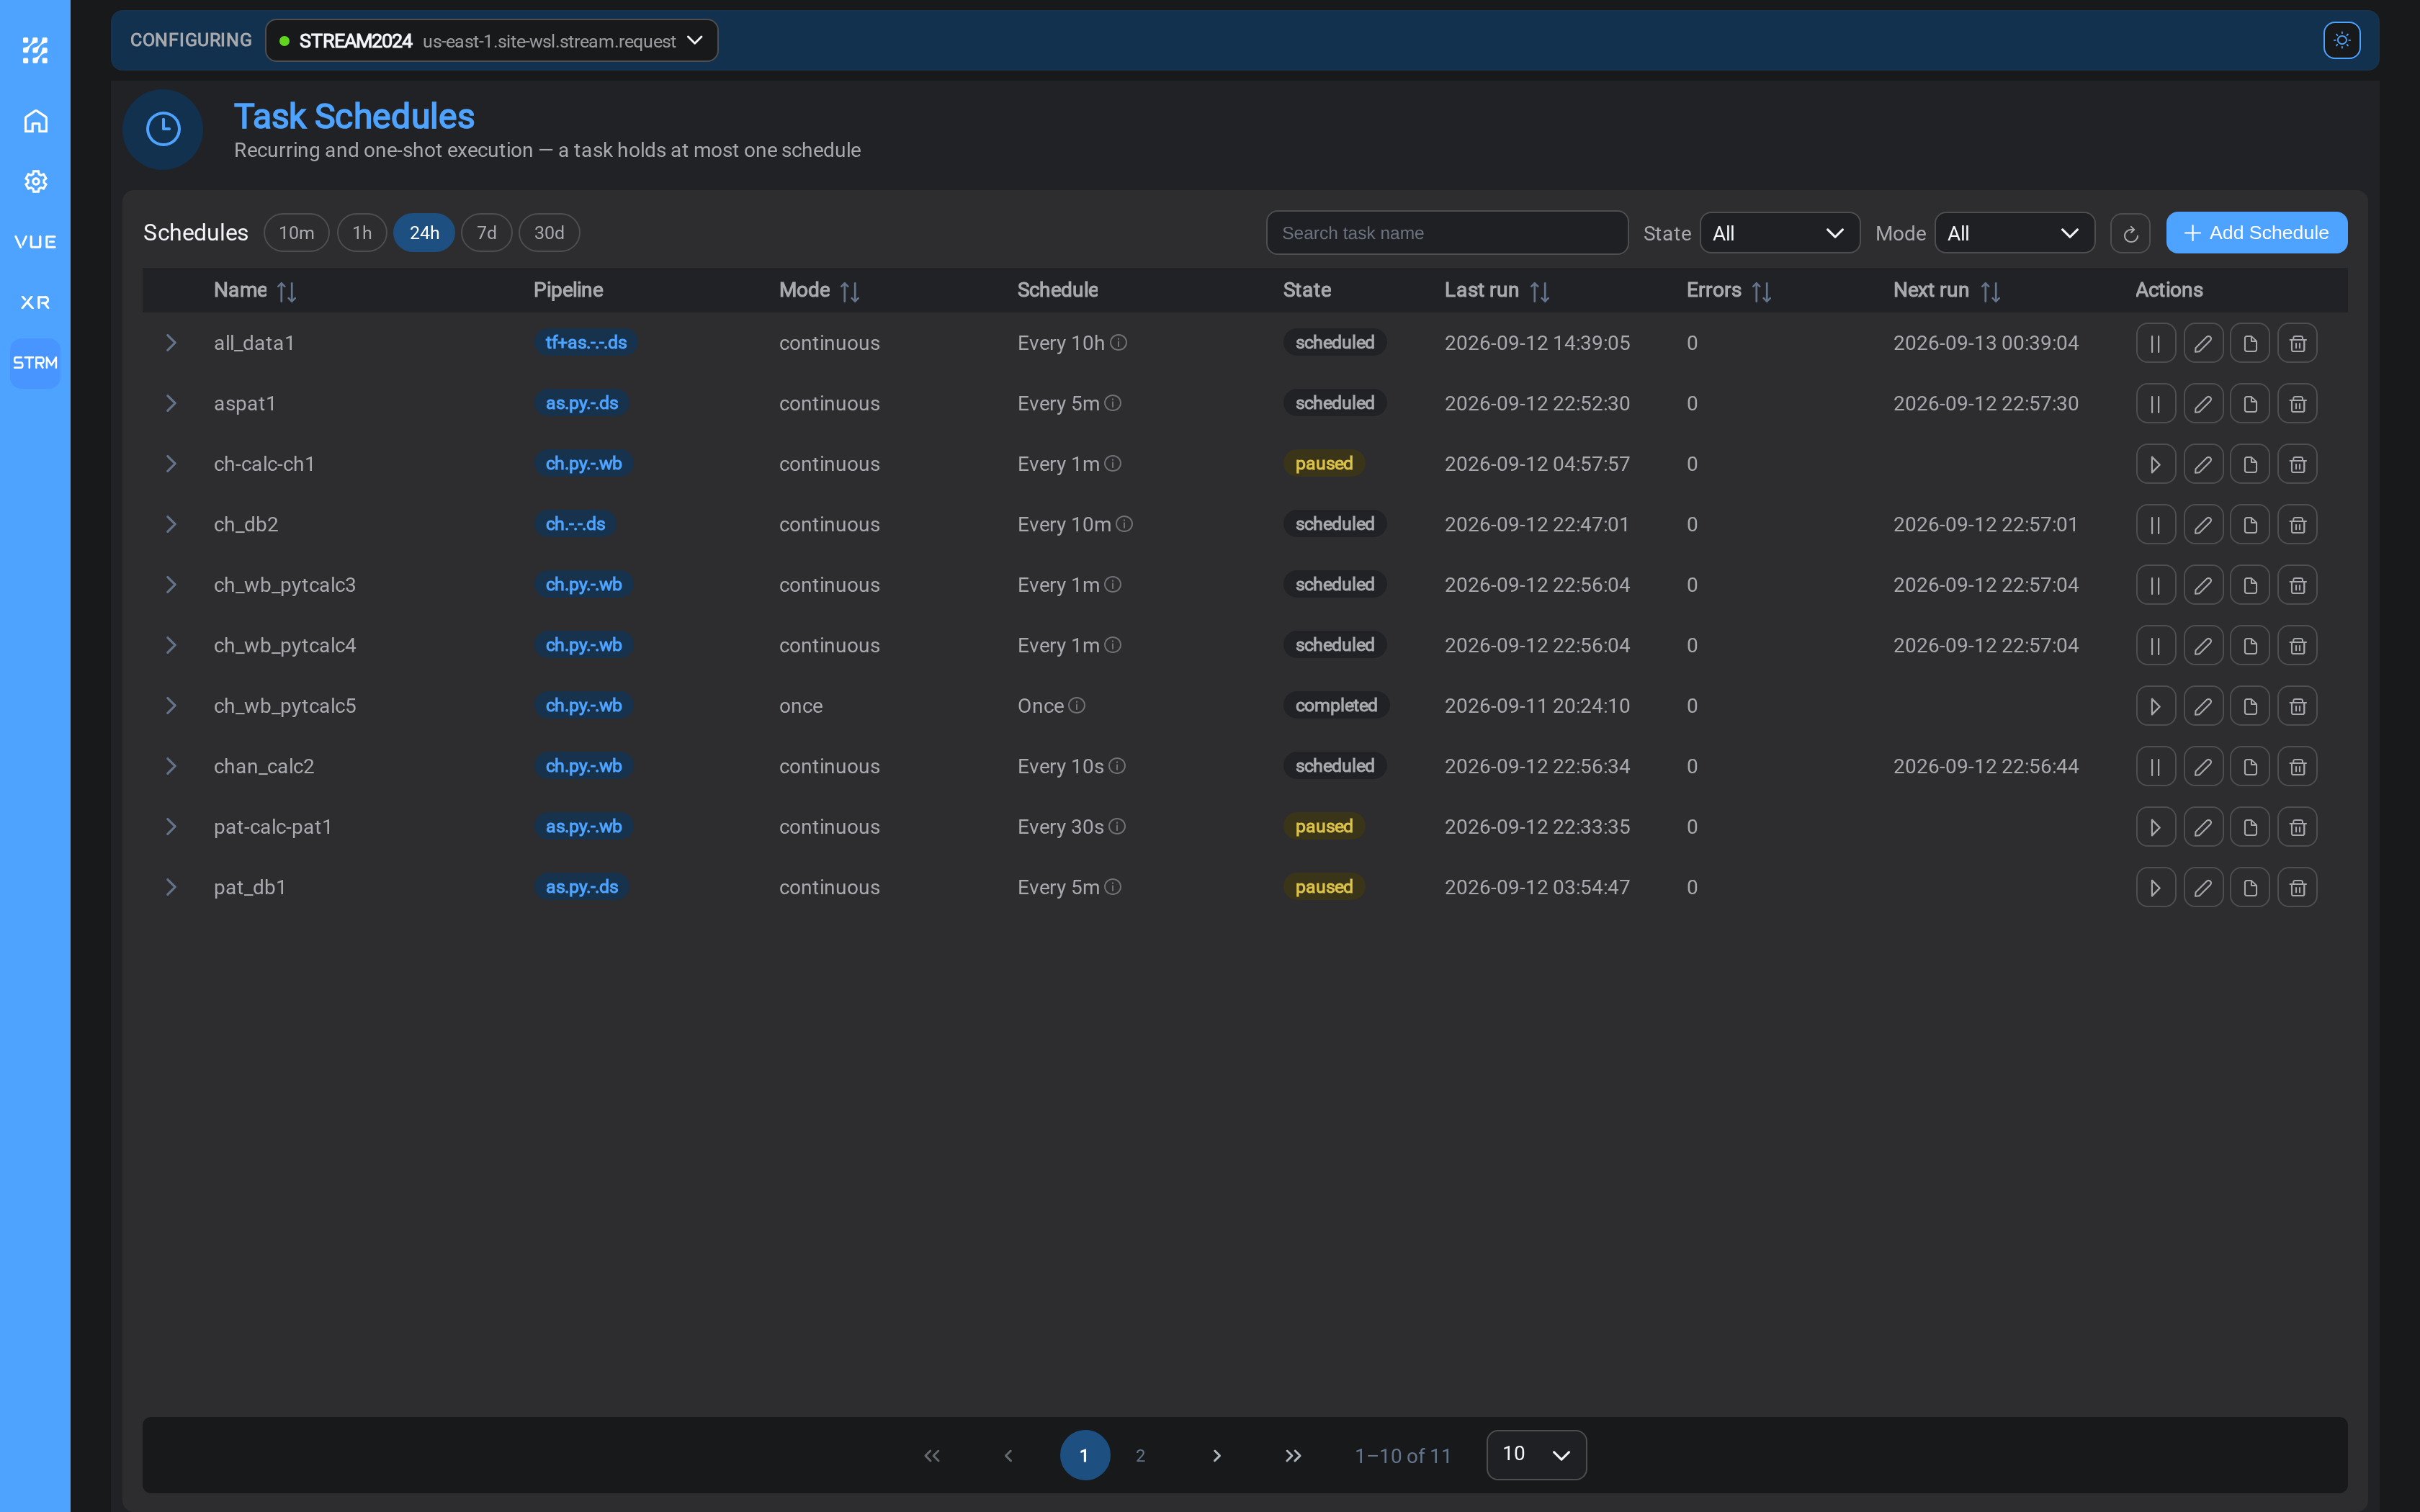
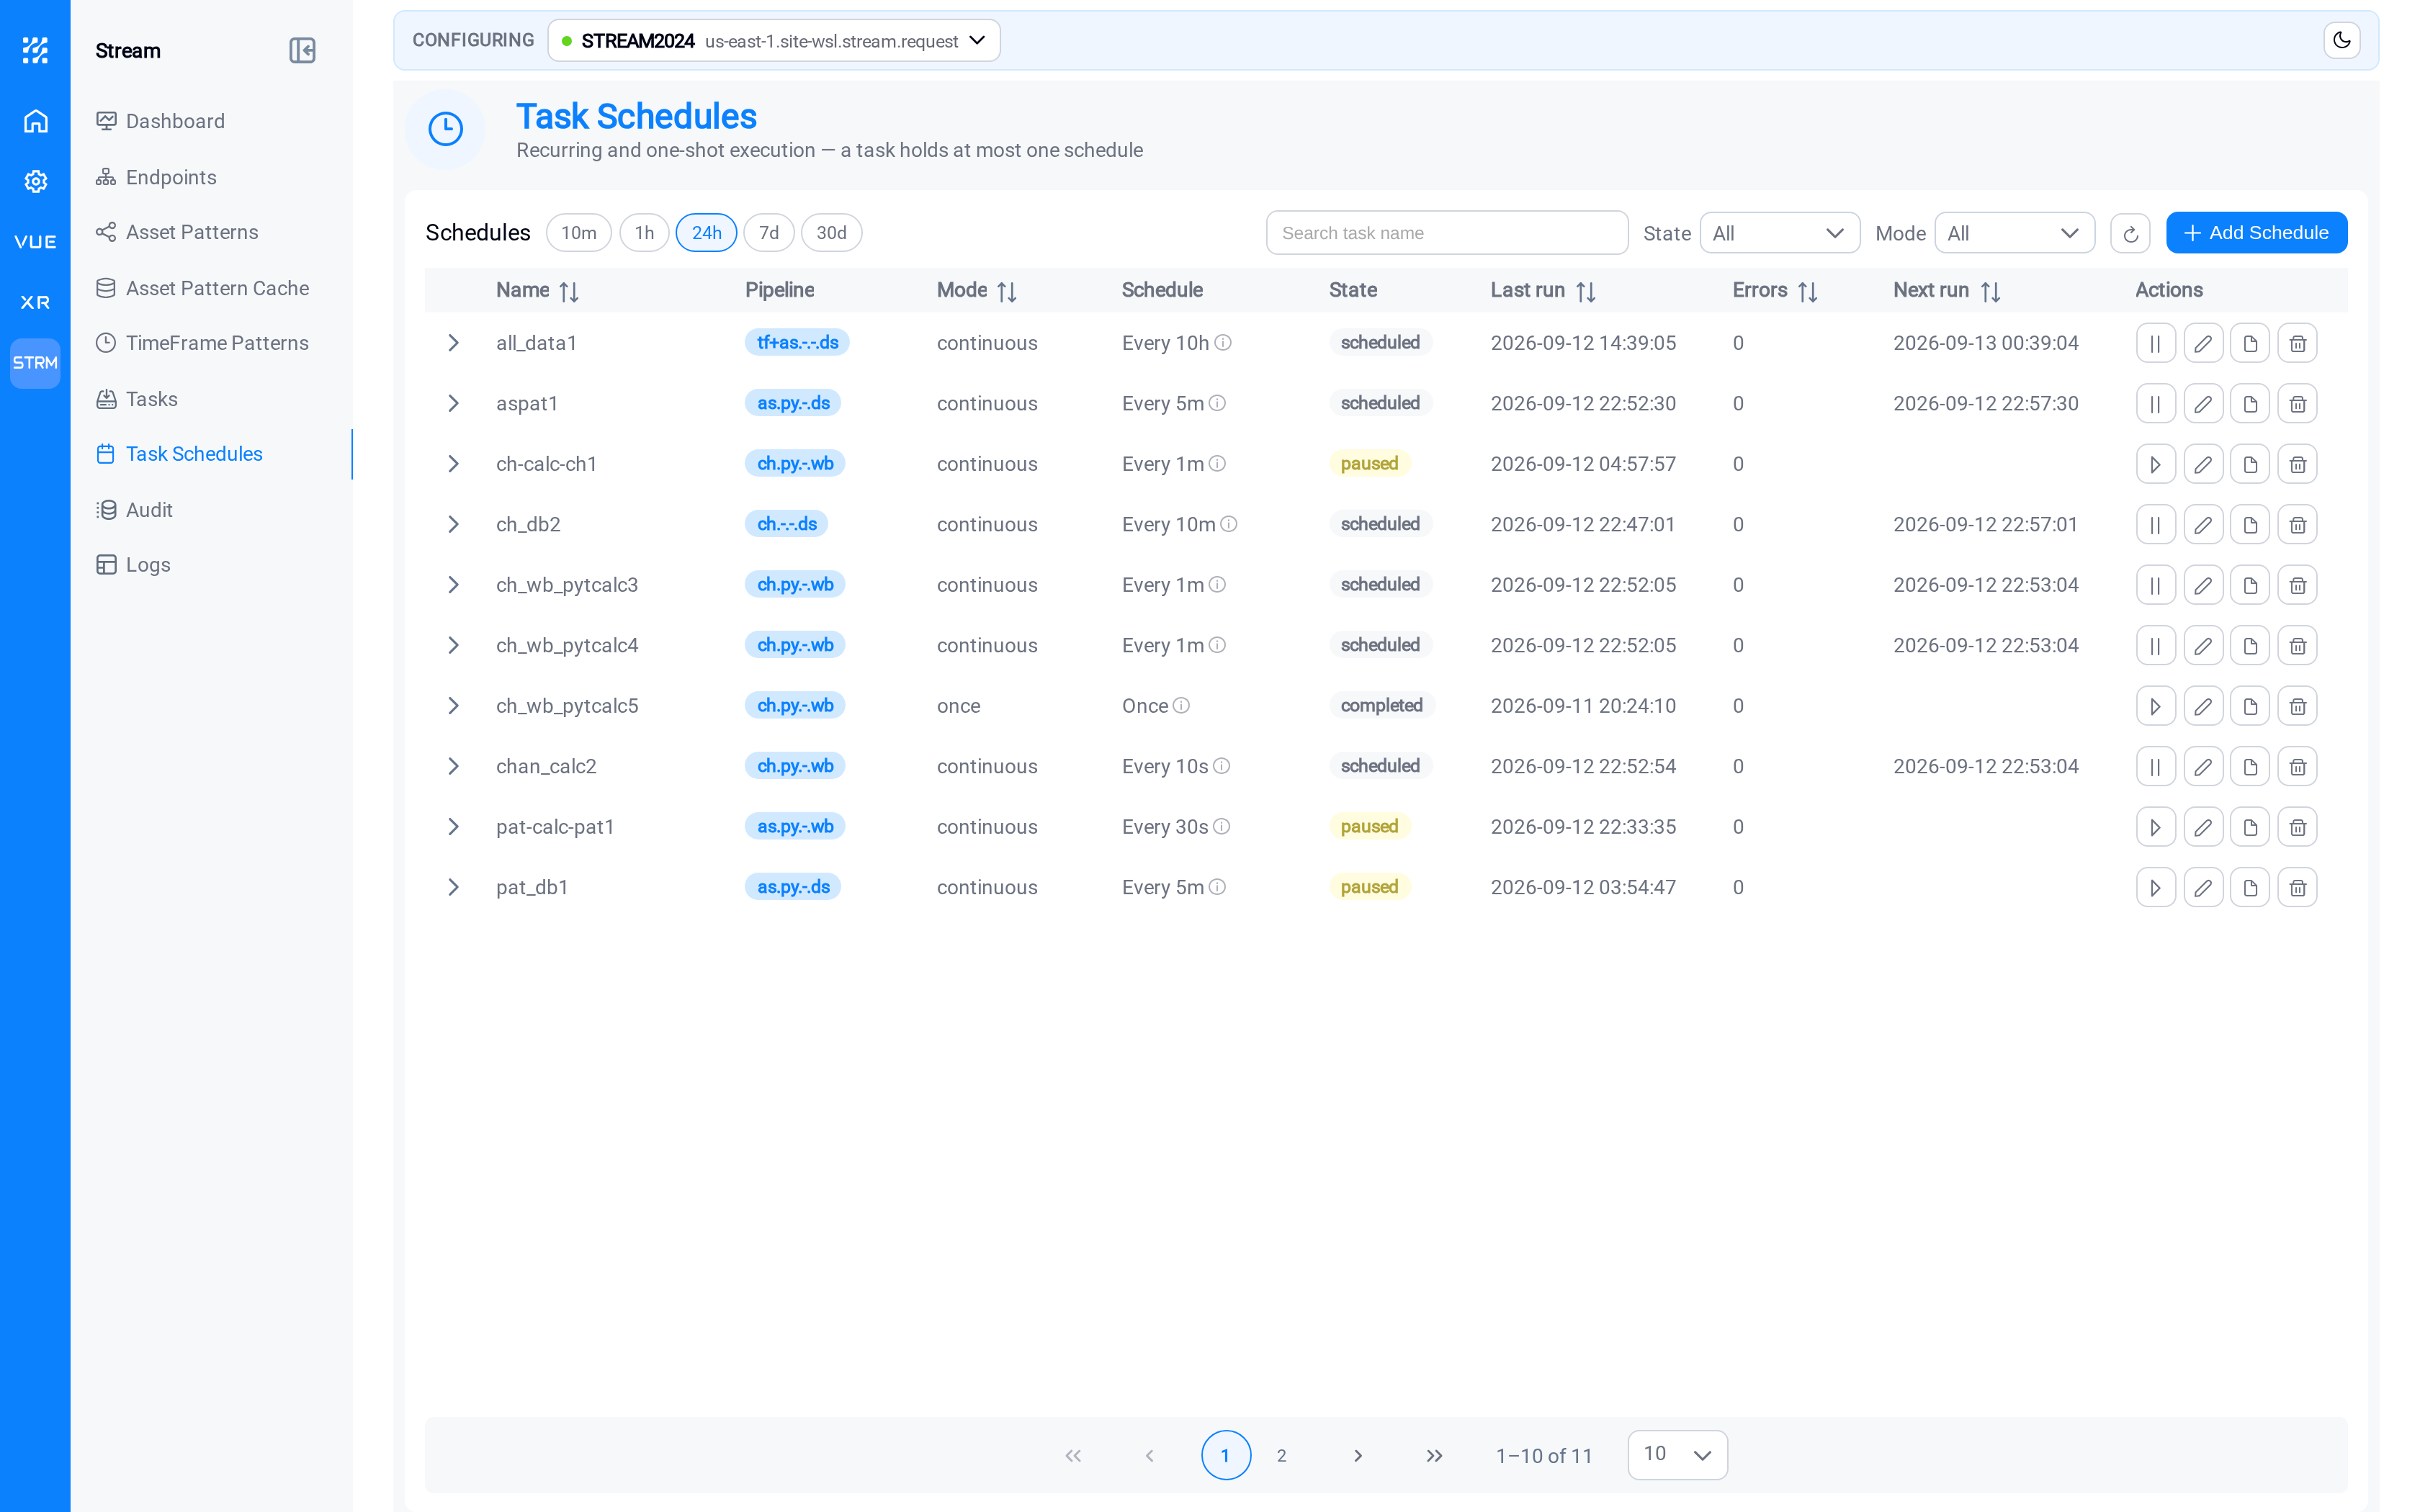
This is the page to open when you want to know whether the overnight work actually
happened.
| Column | What it tells you |
|---|---|
| Name | The task being scheduled |
| Pipeline | What the task is, in the composer's own shorthand |
| Mode | Continuous, or one-shot |
| Schedule | The cadence, in plain words: "Every 10s" |
| State | What it is doing now |
| Last run | When it last executed |
| Errors | How many errors in the current window |
| Next run | When it will run again: empty for anything paused |
A task holds at most one schedule. There is no way to run the same task on two
different cadences; if you need that, copy the task and schedule the copy.
Schedule a task
Select Add Schedule.
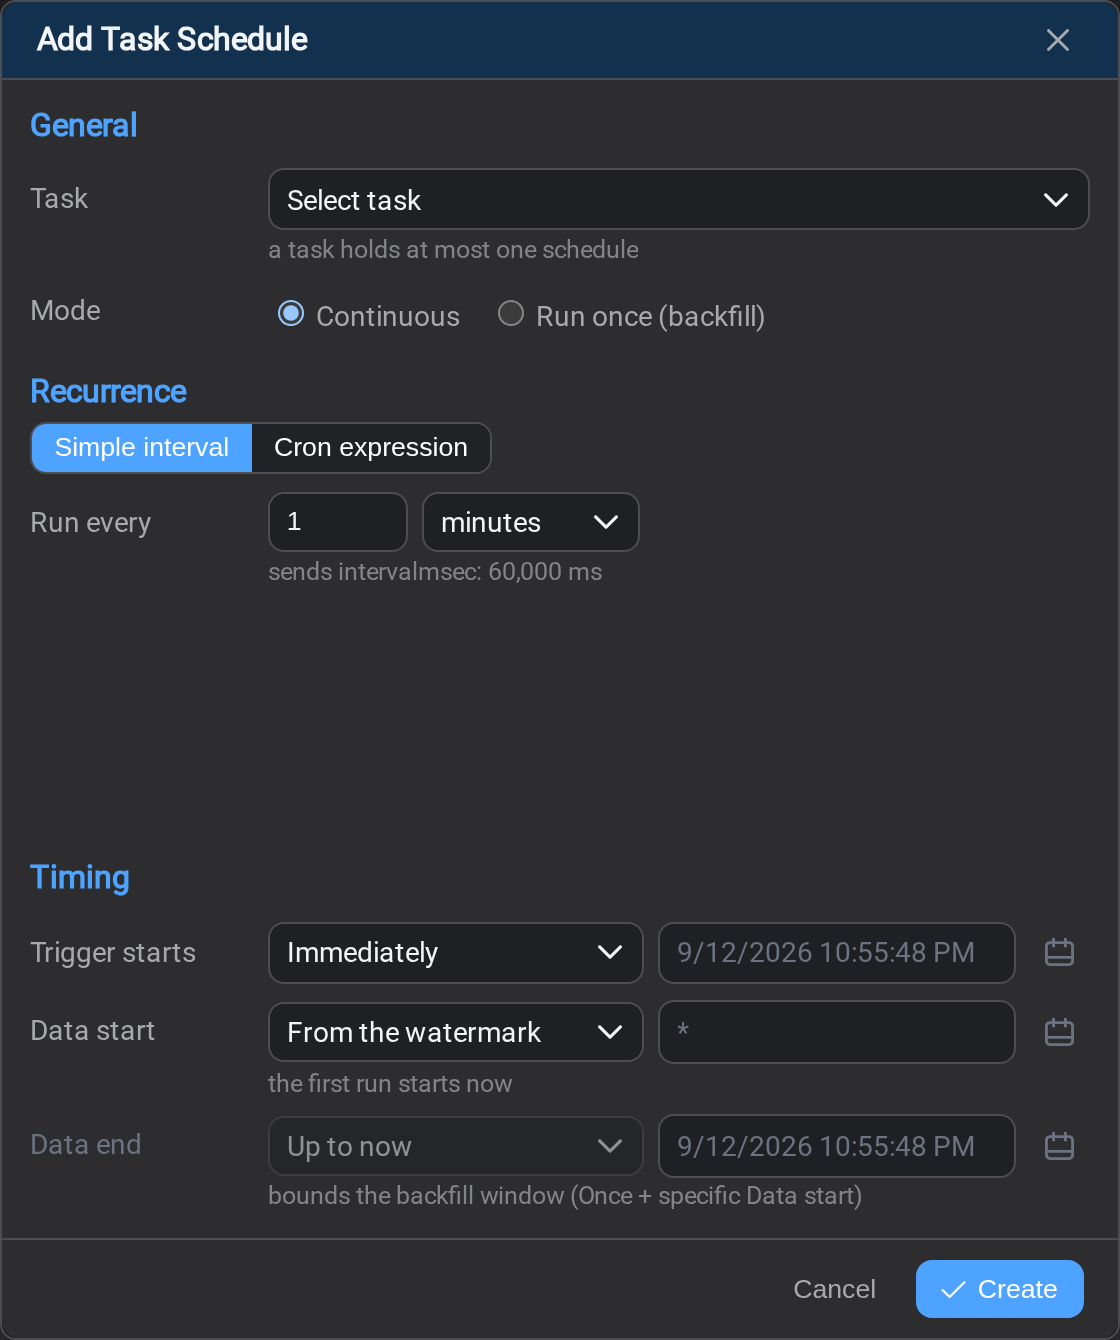
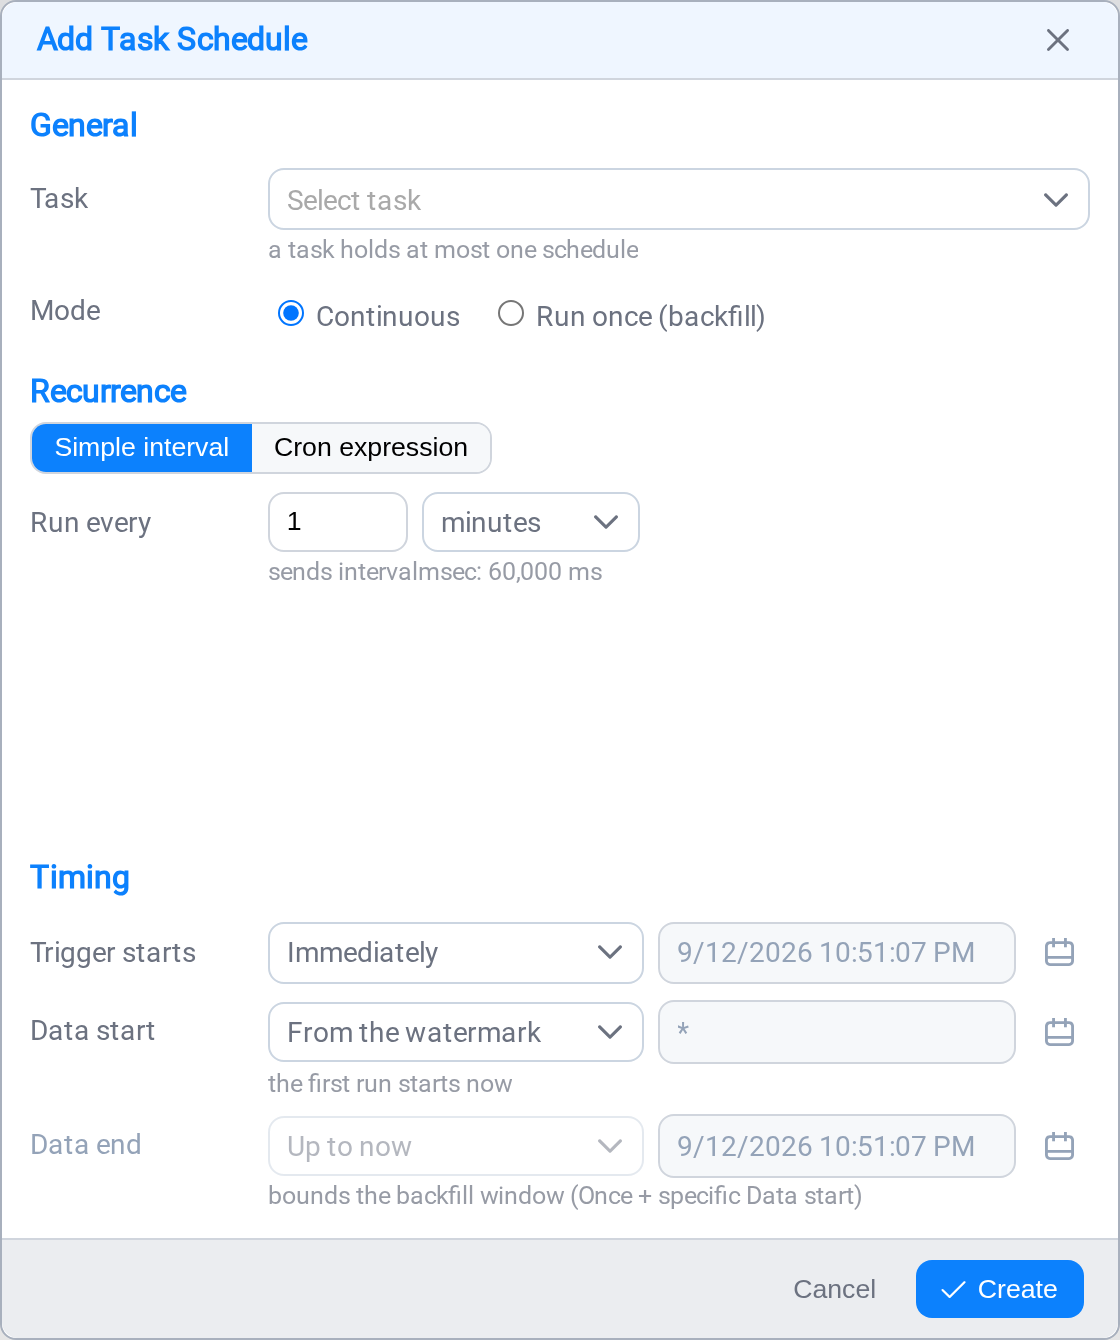
Choose the task, then set the cadence and when it should start.
Mode
| Mode | What it does |
|---|---|
| Continuous | Runs on its cadence indefinitely |
| Run once | Runs one time and stops |
Run once is for backfills: loading a month of history into a new table, for
example. When it finishes it shows Completed, which is its normal end state,
not a fault.
Cadence
Two ways to say how often, and a simple interval covers most jobs.
For anything an interval cannot express, the cron builder offers these:
| Preset | Says |
|---|---|
| Every N minutes | Every 15 minutes, around the clock |
| Hourly, at a given minute | Every hour at :20 past |
| Every day at a set time | 06:30 daily |
| On selected weekdays at a set time | 06:30, Monday/Wednesday/Friday |
| Monthly, on a day of the month | 02:00 on the 1st, the 15th, the last day, or the last weekday |
| Advanced | Type the expression yourself |
Pick a preset, fill in the numbers, and the builder writes the expression for you.
It also shows the cadence back in plain words. Read that before you save: it is the
quickest way to catch "every minute" when you meant "every hour".
The weekday preset, set to the example from the table above:
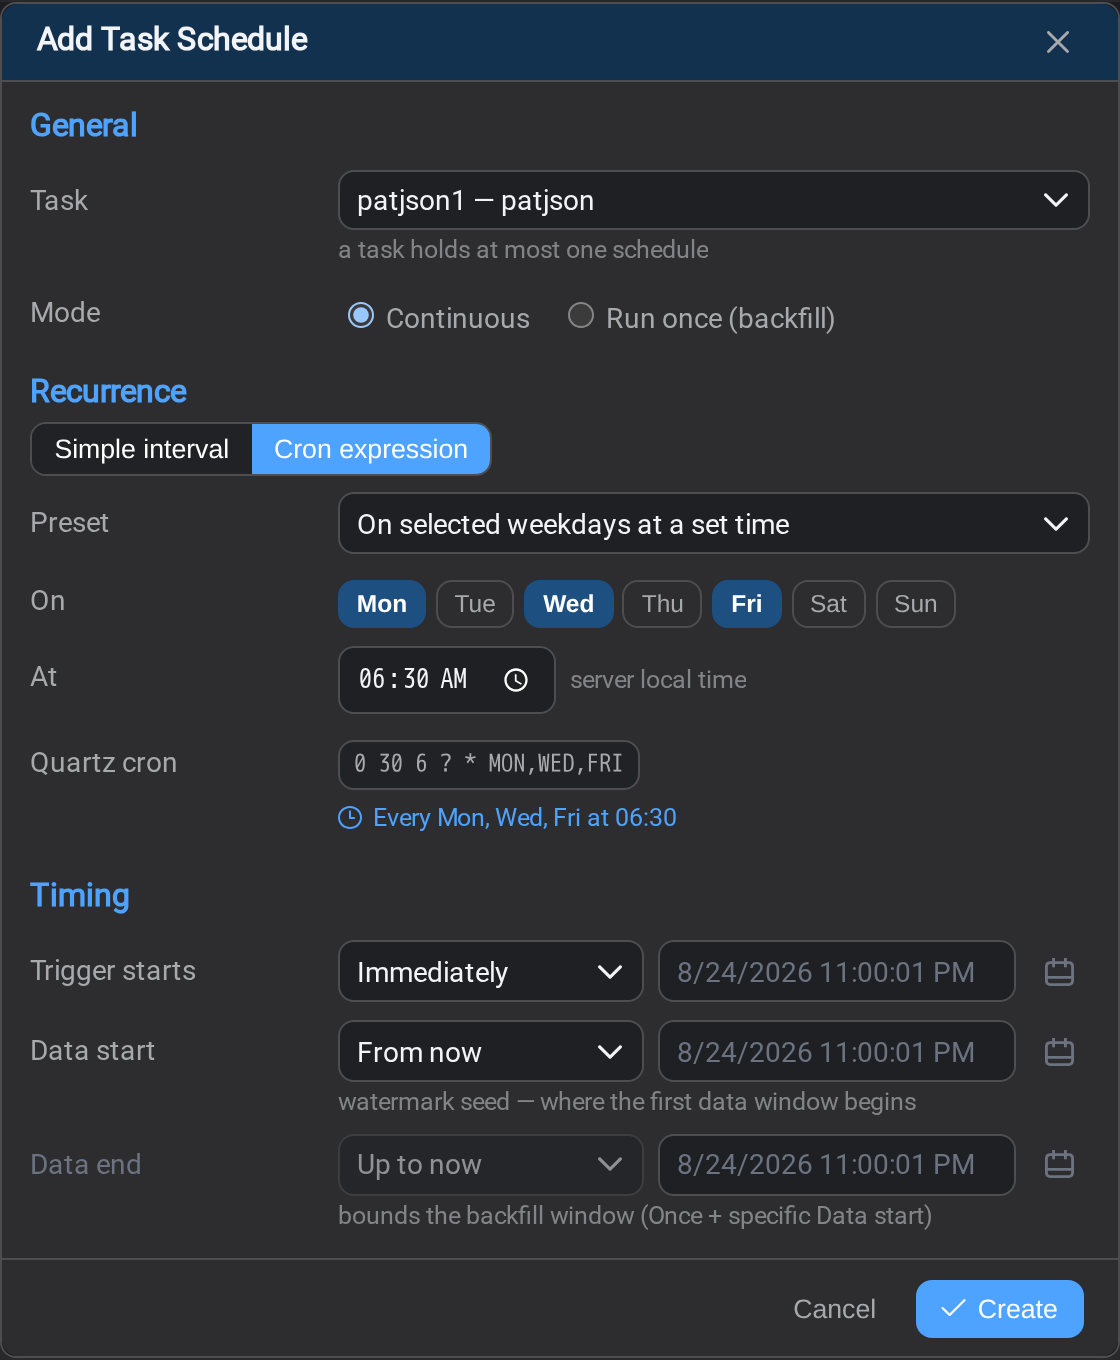
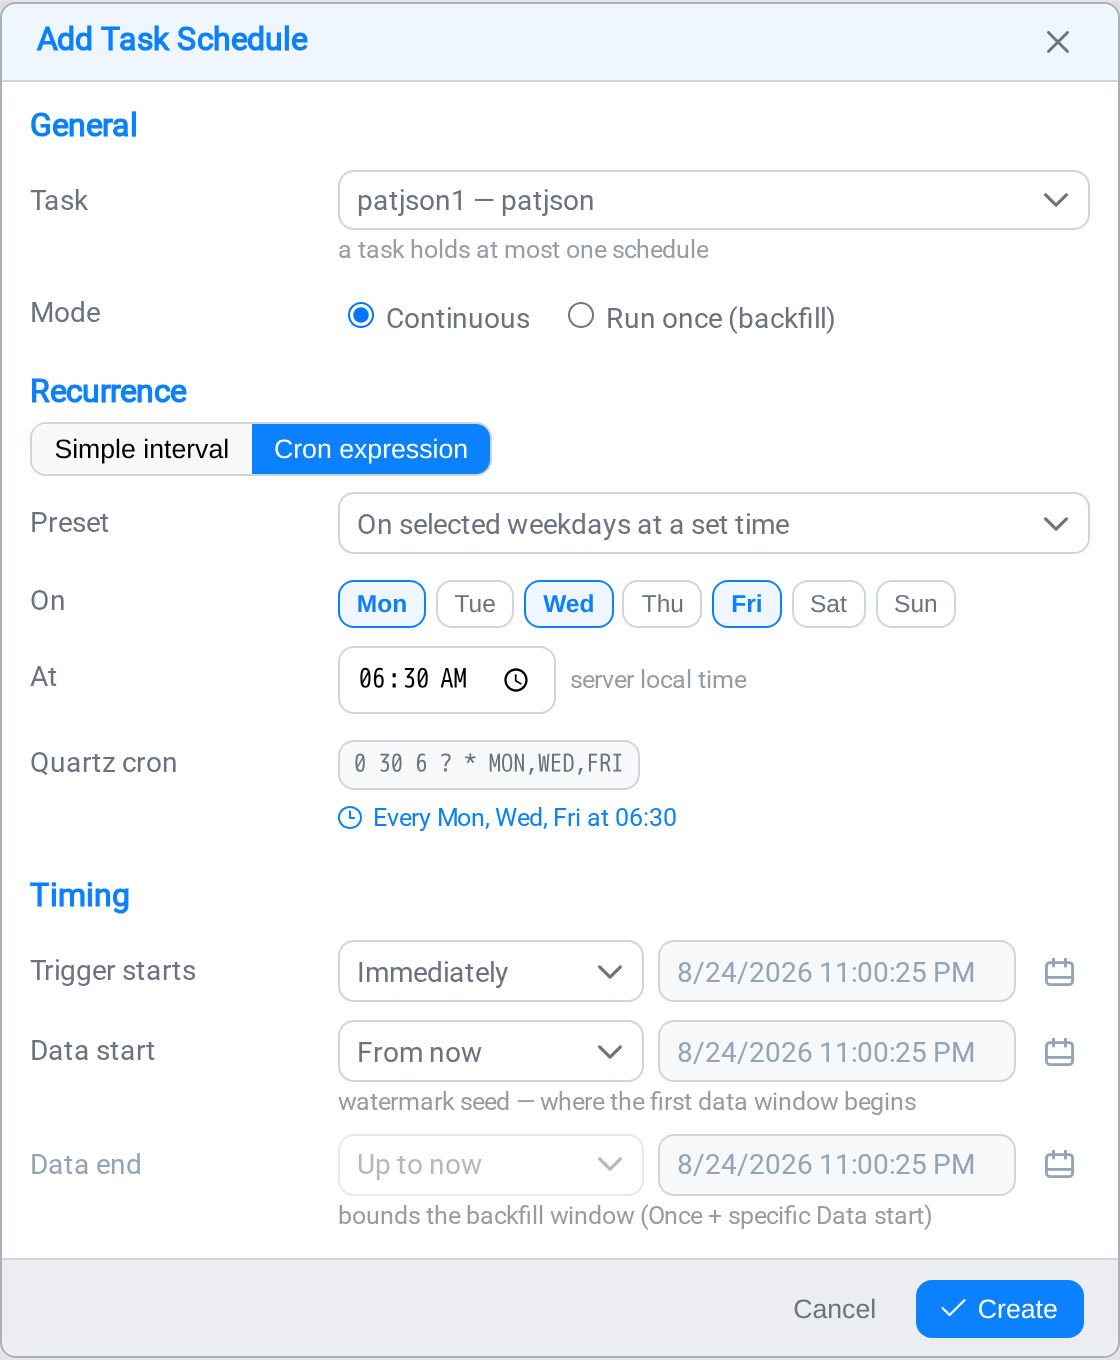
Selecting Mon, Wed and Fri and setting the time to 06:30 produces0 30 6 ? * MON,WED,FRI, and the line beneath reads it back as Every Mon, Wed, Fri
at 06:30. You never have to write the expression yourself, but it is there, and
Advanced lets you edit it directly when a preset cannot say what you mean.
Do not schedule faster than the data arrives
A task scheduled every minute against sensors that report every fifteen will run
fifteen times to find the same reading, and write fifteen near-identical results.
Match the cadence to how often the underlying values actually change.
Timing
Trigger starts decides when the schedule begins: Immediately, or a date and
time you choose. Deferring the start is useful for a first run you would rather
happen out of hours.
Where a run starts reading
Trigger starts says when the task wakes up. Data start says where it reads
from, which is a different question and the one that causes the most confusion.
A task that has run keeps a watermark: the instant it has read up to. Every run
begins there and ends at now, and when it finishes it moves the watermark forward.
That is what stops a task re-reading data it has already processed, and it is why
two consecutive runs never produce the same rows twice.
| Choice | What the next run does |
|---|---|
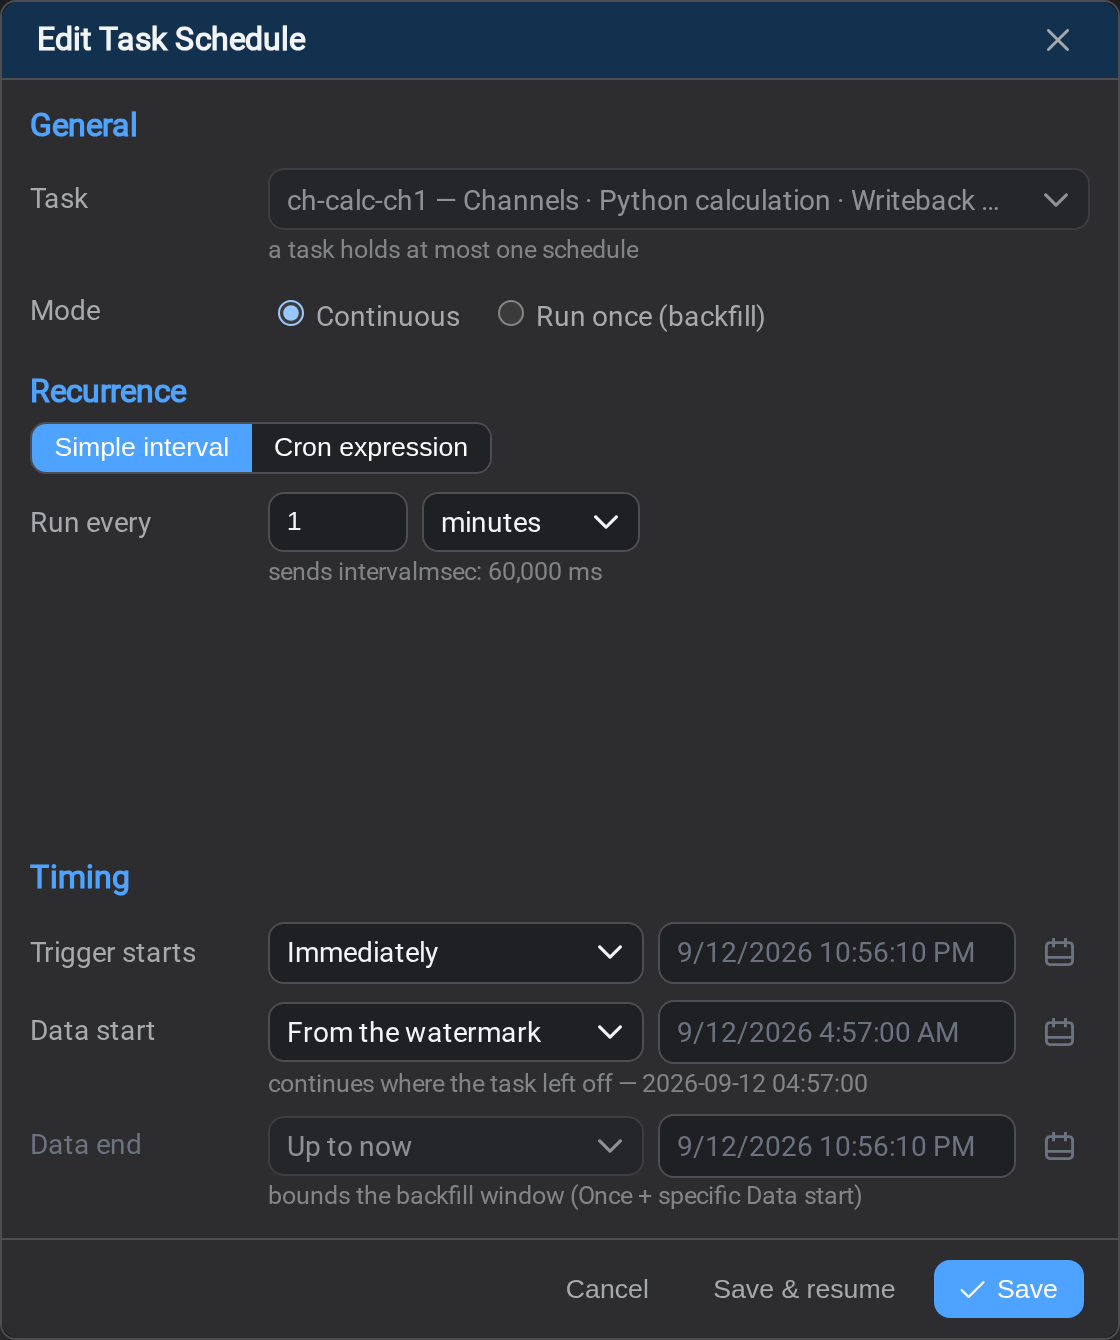
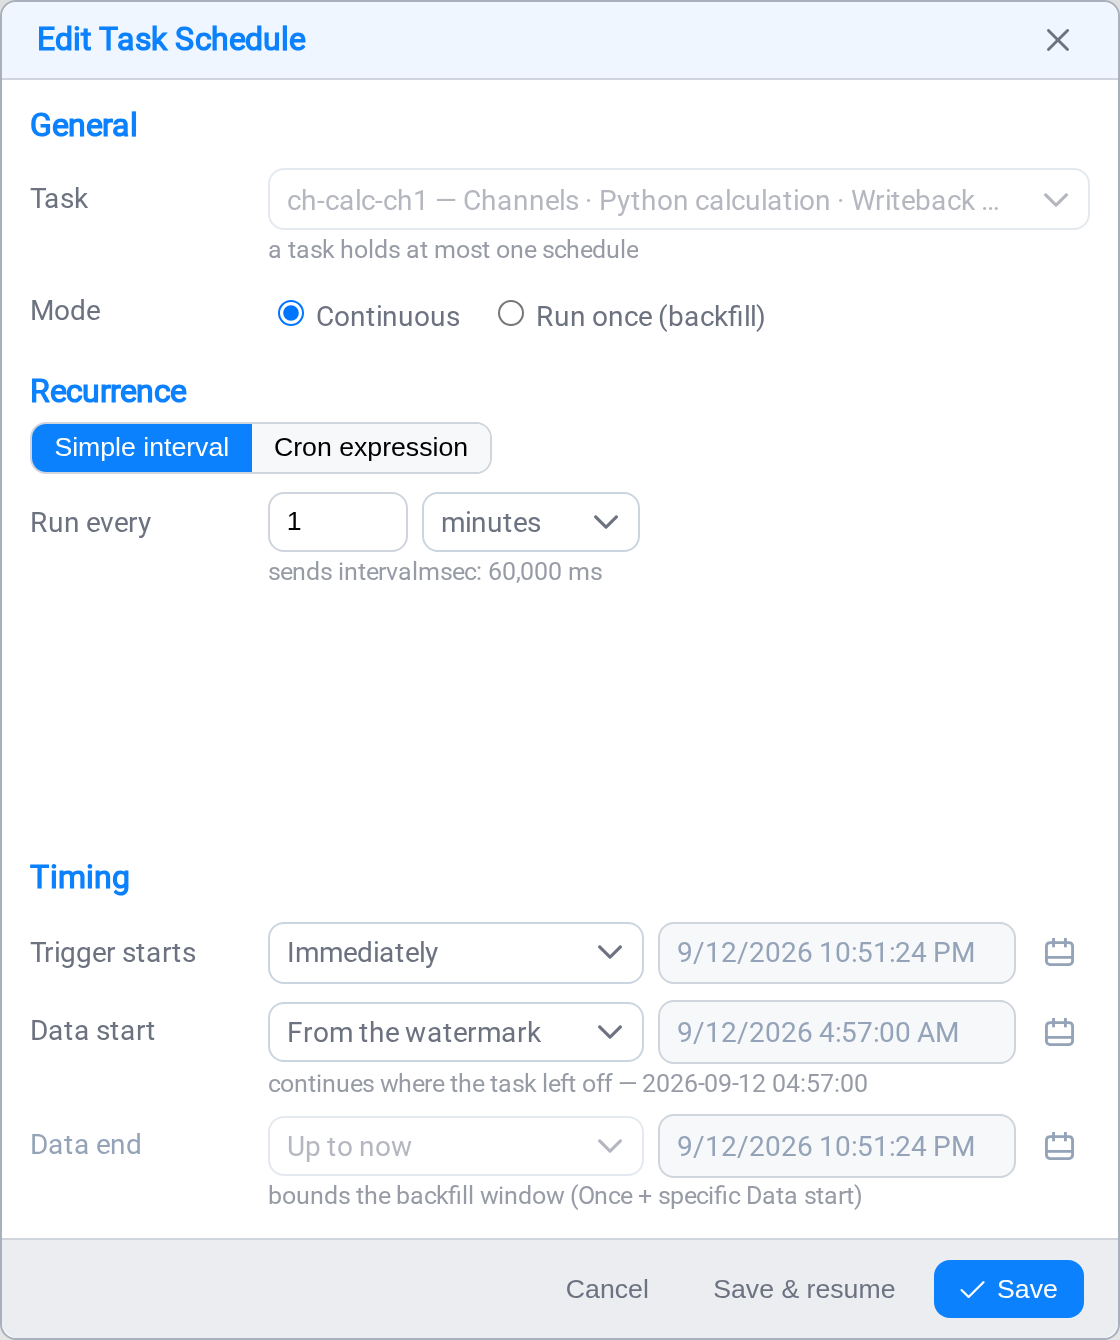
| From the watermark | Carries on where the task left off. The box shows that position and cannot be edited: it is the task's, not yours |
| From a specific time (override) | Rewinds the task to the time you name, so it reads that window again |
On a schedule that has never run there is no watermark to continue from, so the box
shows * and the task starts from now.
An override is a rewind, not a setting
Choosing a specific time does not just store a date. On save it moves the task's
watermark, and on a pattern task it also resets each matched asset's own position so
those matches restart from the same instant. Output already written is not
deleted, whether the re-run replaces those rows or adds to them is the task's
write mode.
Both an absolute date and a relative expression work: *-2mo reads "two months
before now", and it is resolved when you press Save, not when you opened the
dialog.
Reprocessing a window
This is how you recover. A column arrived with the wrong type, a calculation had a
bug, a source was down for a day: fix the cause, then set Data start back to
before the damage and save. The task re-reads that window on its next run.
Moving the watermark forward is the dangerous direction, and the dialog treats
it as one: everything between the current position and the time you named is
skipped permanently. Nothing reads it again, and nothing reports it missing. The
form asks you to confirm that in so many words before it will save.
Changing a schedule
A live schedule cannot be edited. A run can start at any moment, and a run that
finishes mid-change writes its own state over yours, so the schedule has to be
stopped first.
Selecting Edit on a running schedule offers to do exactly that:
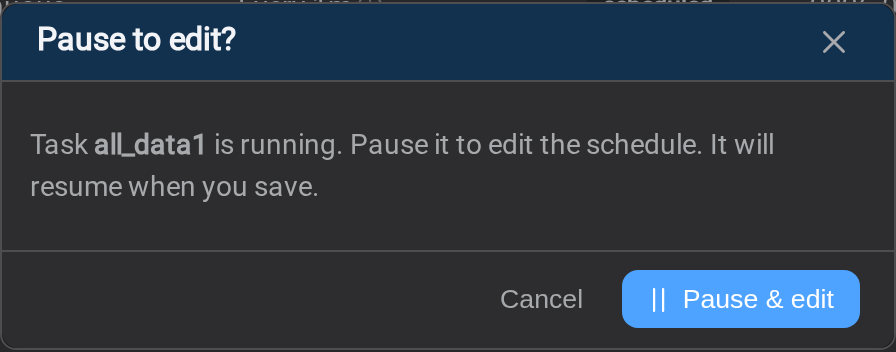
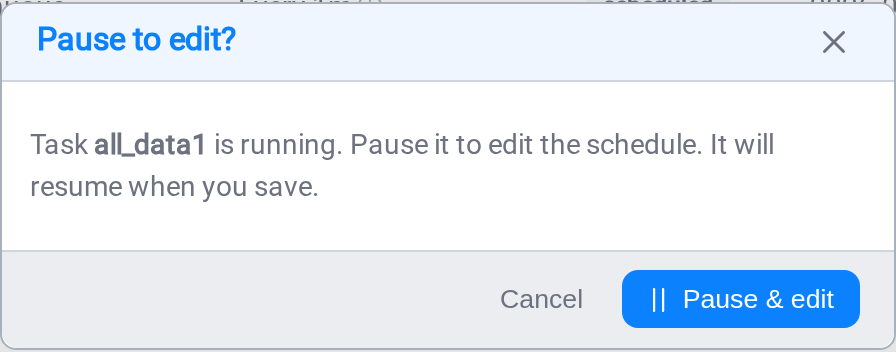
Agree, and it pauses the schedule and opens the editor in one step. Nothing is
paused without being asked: a paused task is a task collecting nothing.
An edited schedule stays paused until you put it back, which is why the dialog
offers both endings:
| Button | Leaves the schedule |
|---|---|
| Save & resume | Running again on the new settings |
| Save, stay paused | Stopped, for you to resume when you are ready |
Whichever was true when you opened the dialog is the one offered first, so the
default puts the schedule back the way you found it. A line above the list confirms
what happened.
Reading the states
| State | Meaning |
|---|---|
| Running | Executing right now |
| Scheduled | Waiting for its next run |
| Paused | Will not run until you resume it |
| Completed | A Run once schedule that has finished |
| Error | The last run failed |
Filter by Error first thing in the morning and you have your list of what needs
attention.
Watching a schedule perform
Expand a row with the ⌄ control to see how that schedule has been behaving.
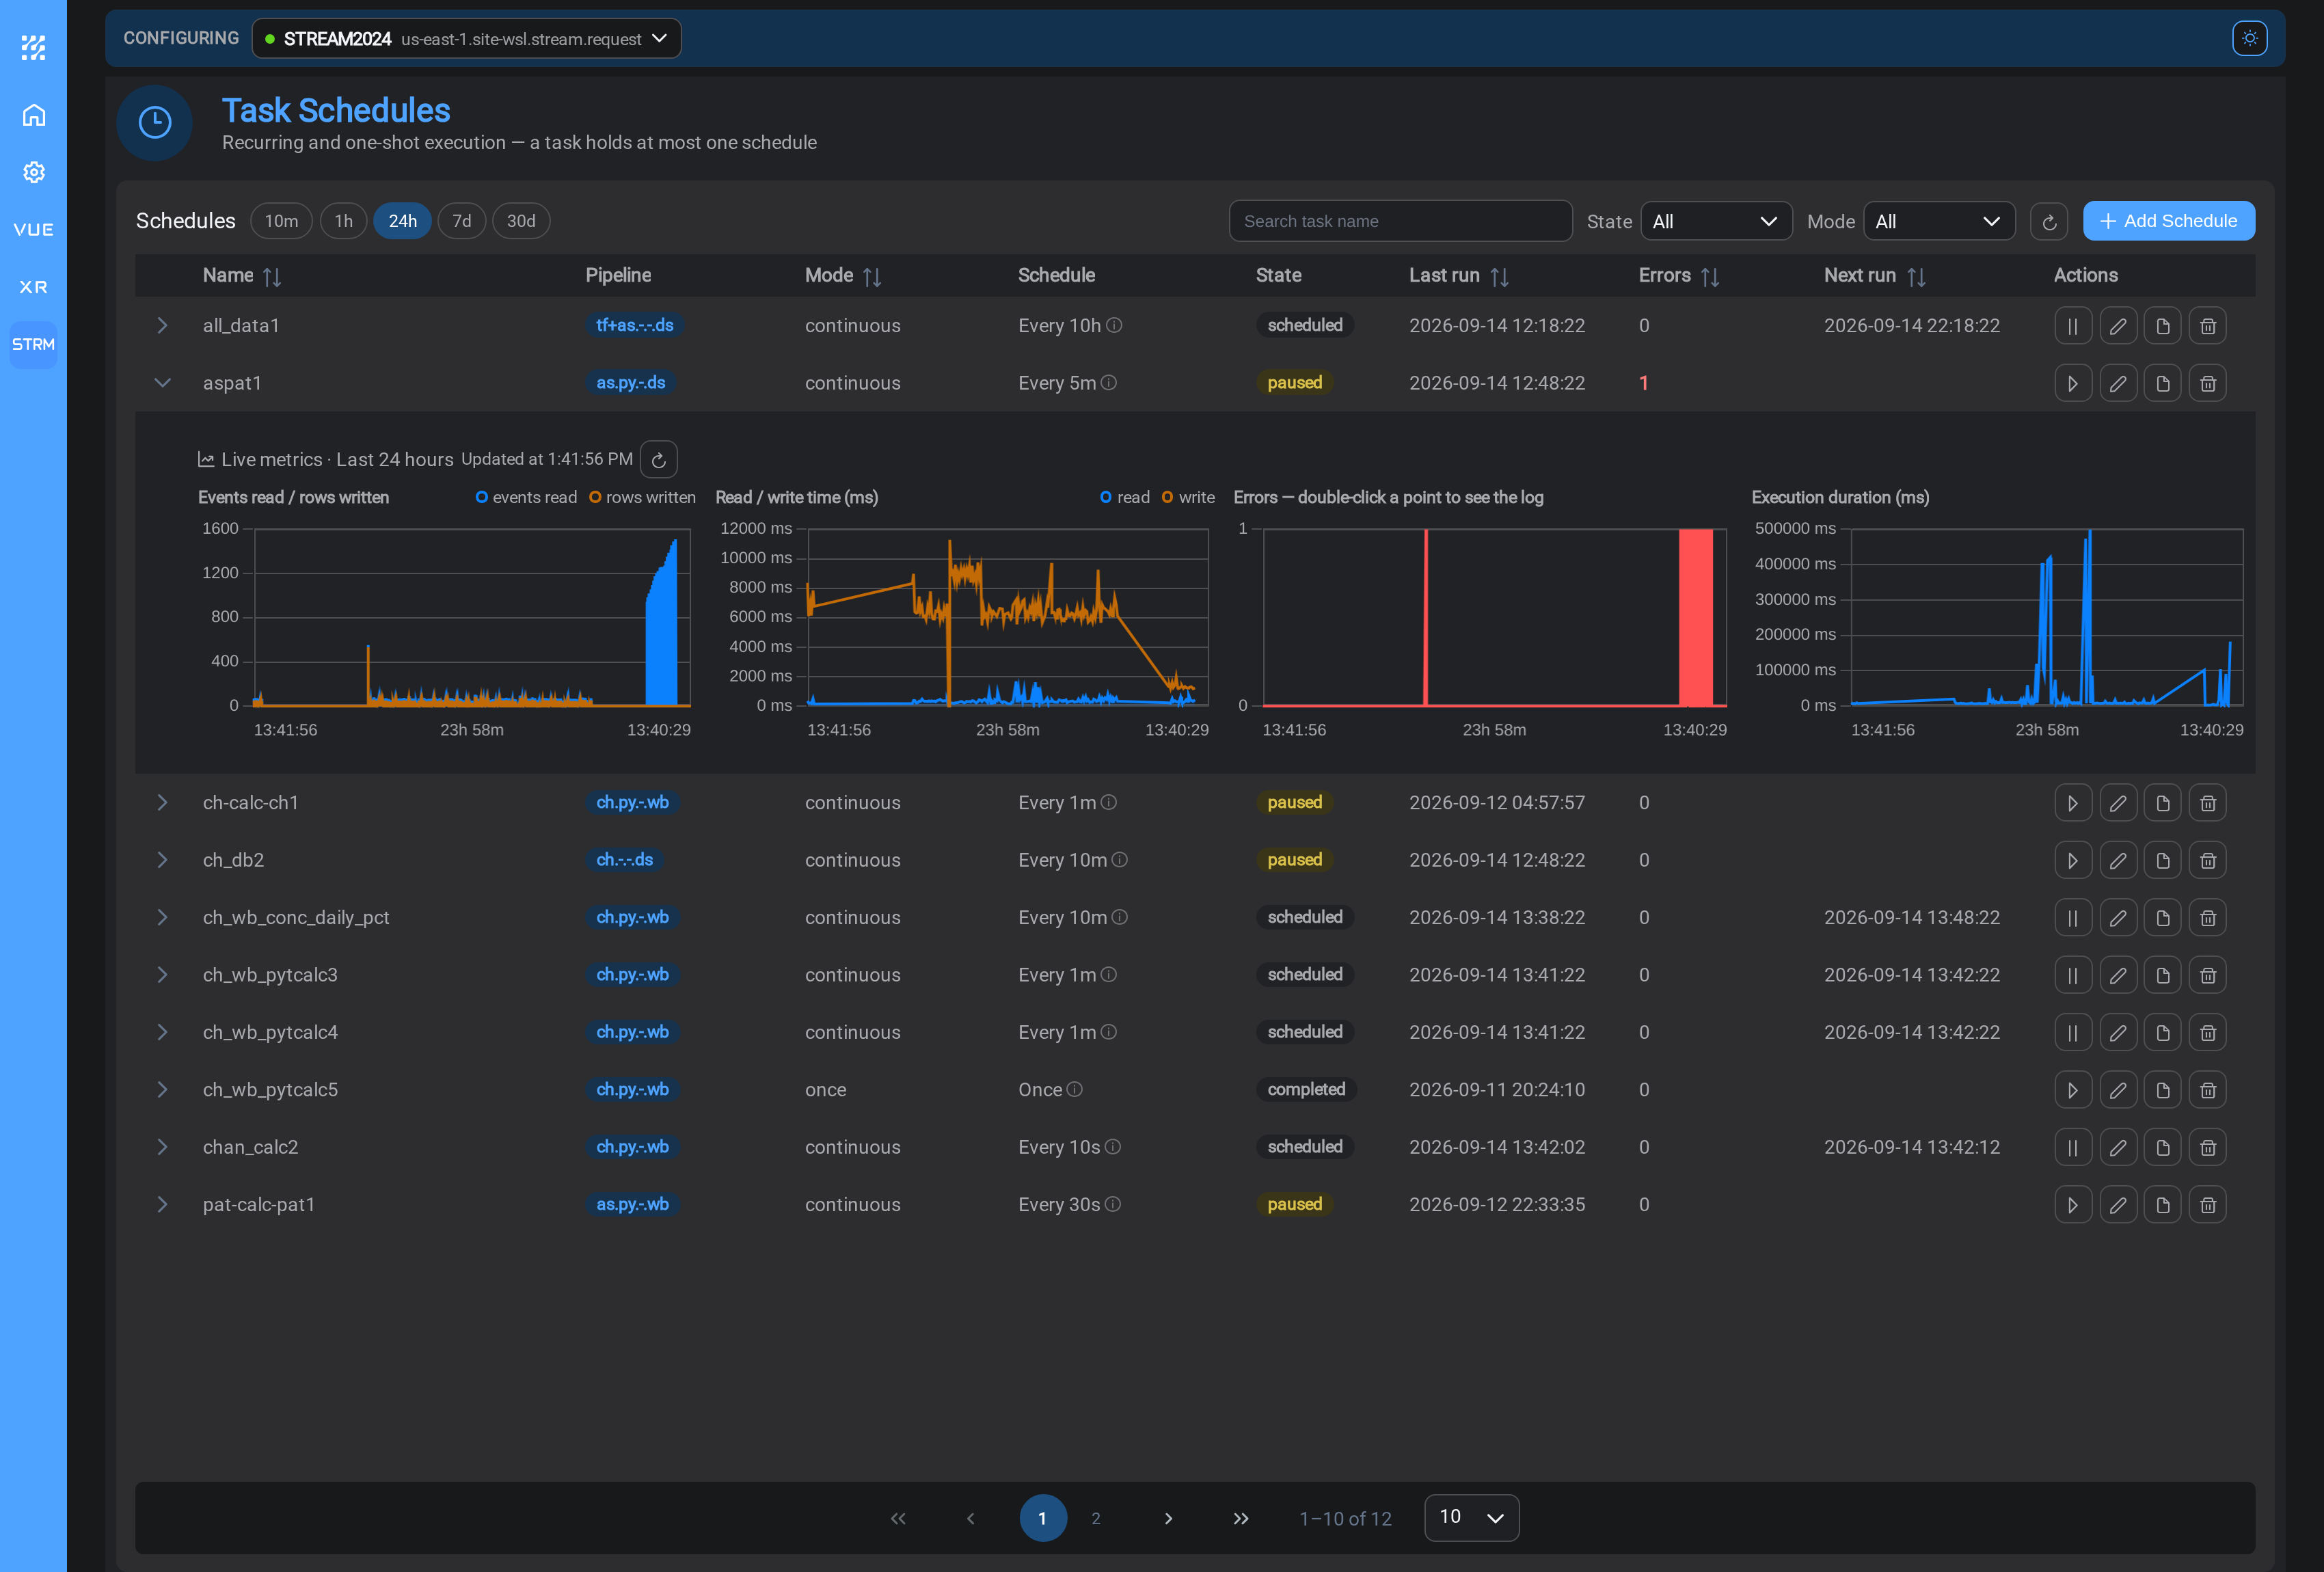
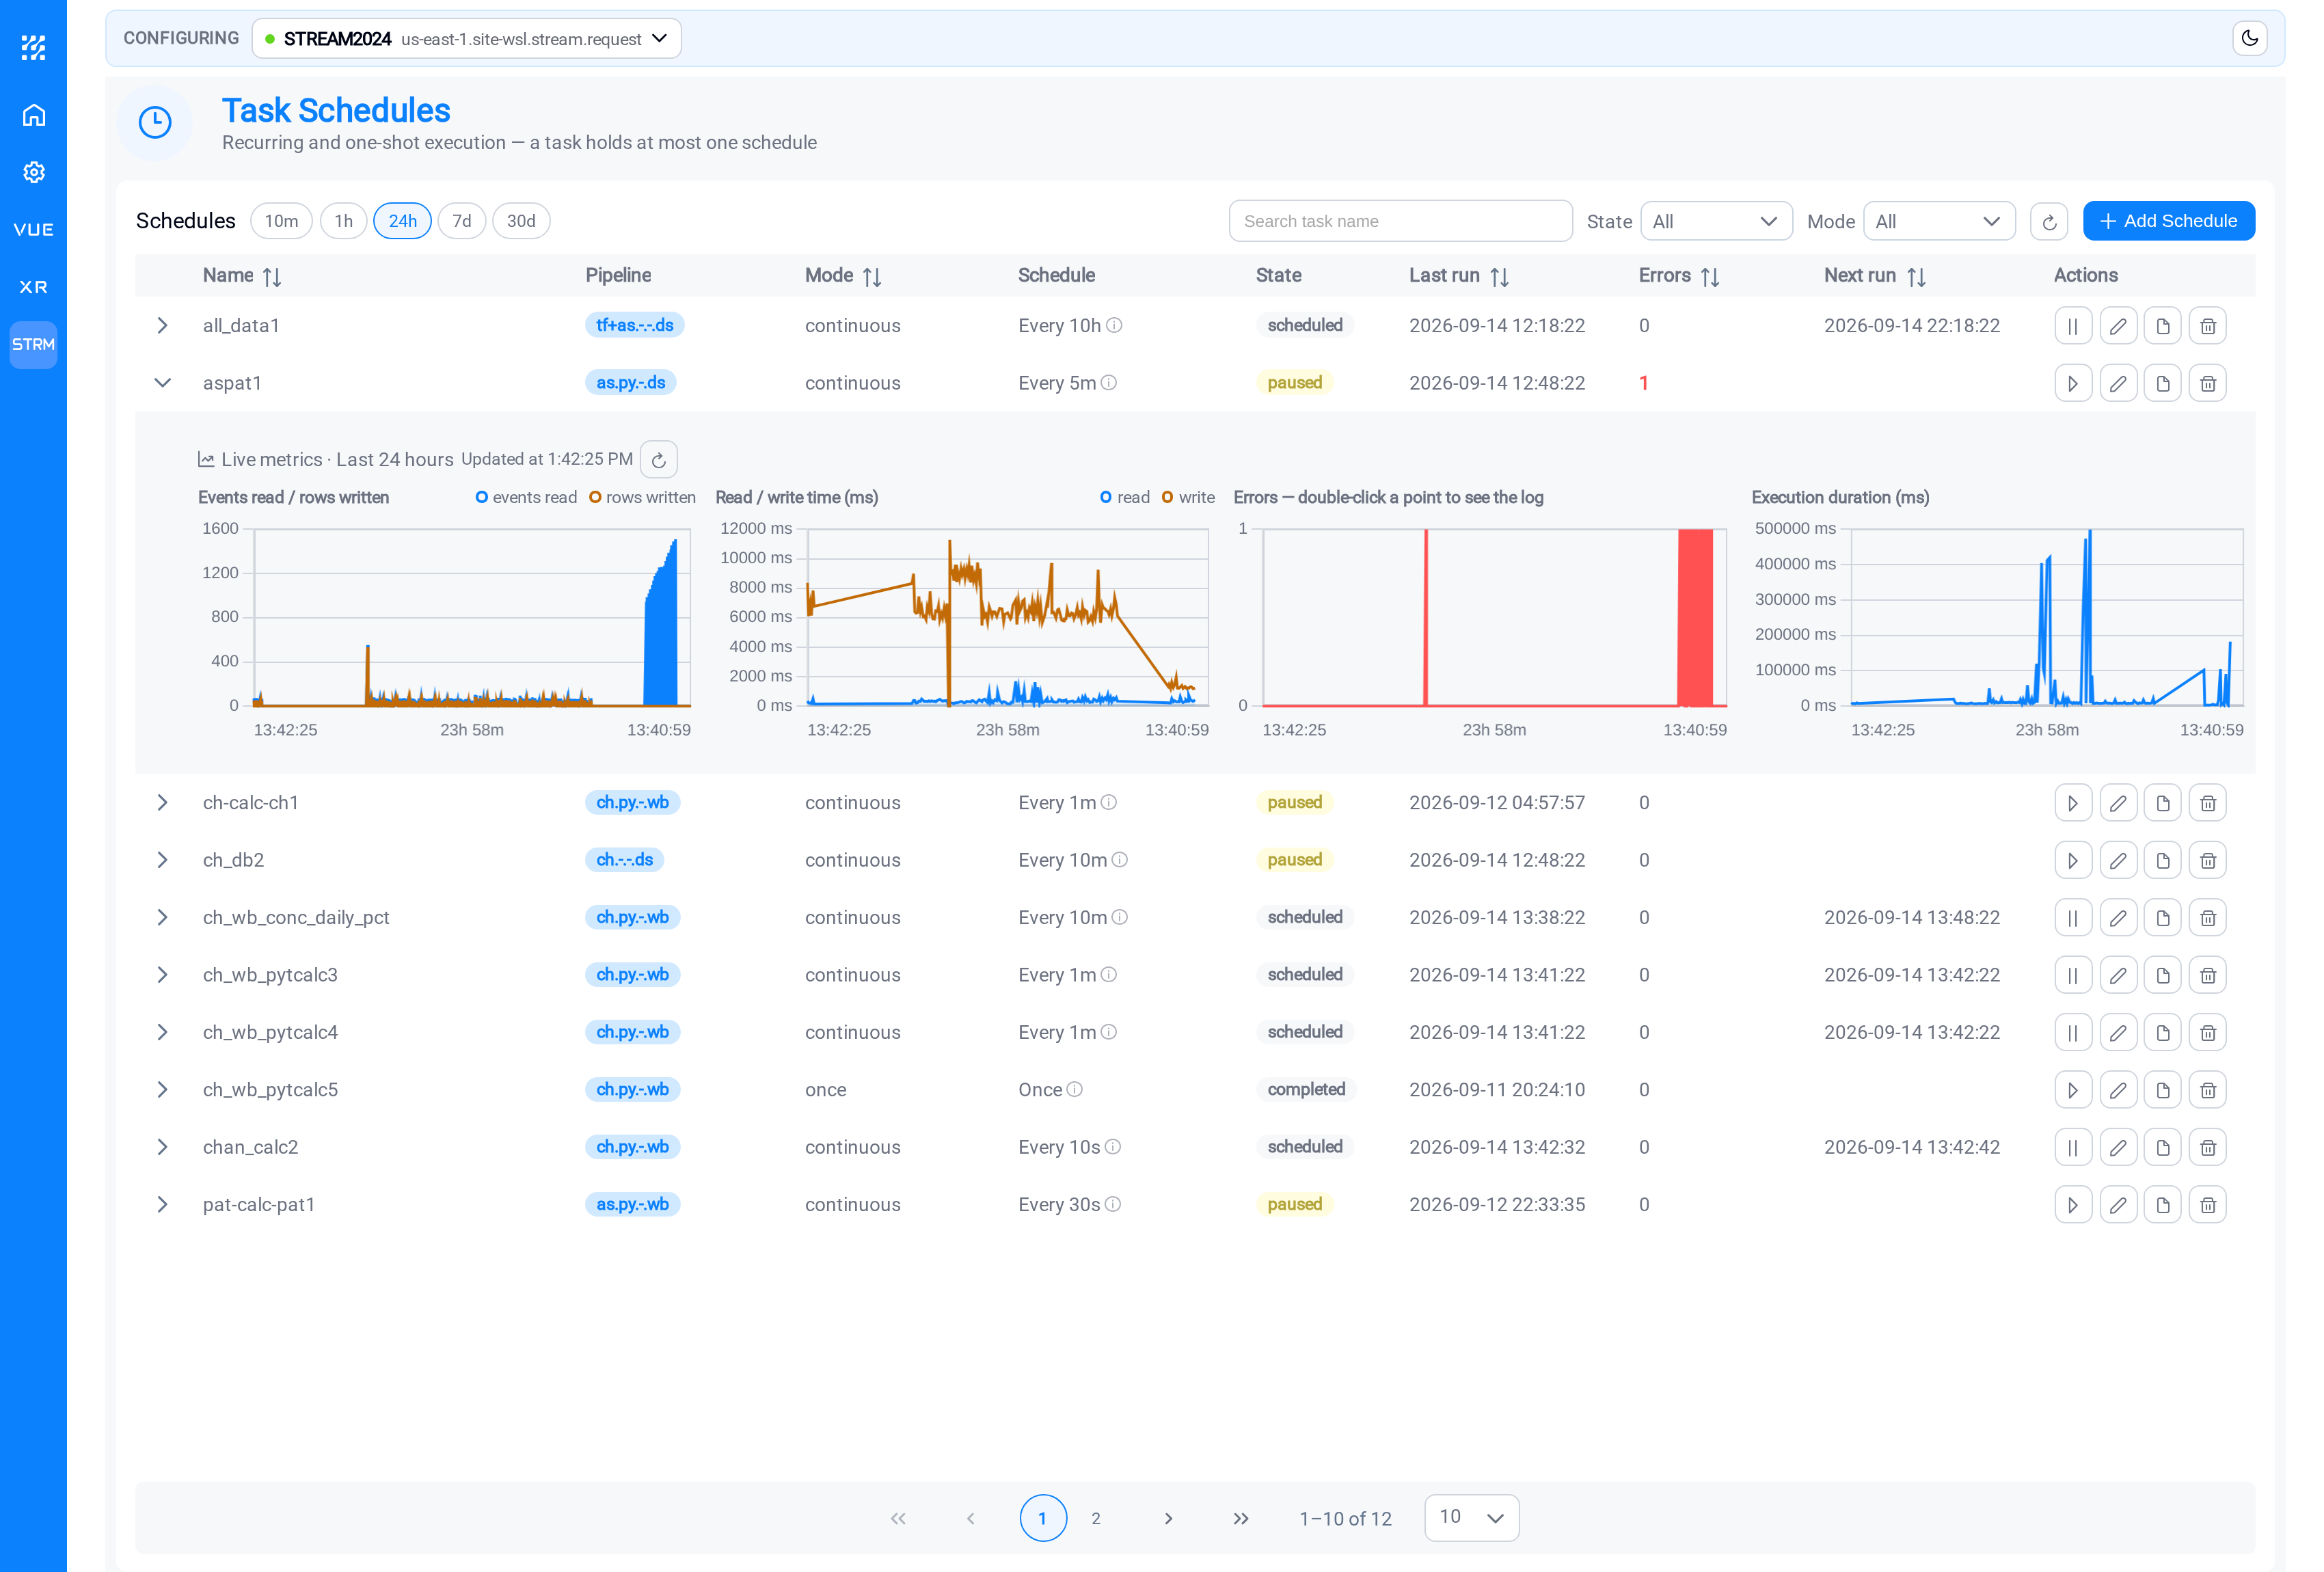
Four trends, each answering a different question:
| Trend | Tells you |
|---|---|
| Events read / rows written | Whether the task is finding data, and producing output from it |
| Read / write time | Which end is slow: the PI System or the destination |
| Errors | When failures happened |
| Execution duration | Whether runs are getting longer |
The schedule above is a failing one: the Errors trend carries real spikes, and the Execution duration beside it climbs
into hundreds of seconds around them. Failures and long runs arriving together is
the commonest shape there is: the task is retrying or timing out, not quietly
returning nothing.
A paused schedule looks nothing like that. It leaves a gap in every trend at
once with no errors beside it, and that flat stretch is worth recognising for what
it is rather than reading as a fault.
The pair in the first chart is the most diagnostic thing on the page. Events read
climbing while rows written stays flat means the task is reading data and writing
nothing: a mapping or calculation problem, not a connection one. Both flat means
it is finding nothing to read, which points at the pattern or its cache.
Read / write time separates a slow PI System from a slow destination, which
otherwise both look like "the task is slow".
Execution duration is worth watching even when nothing fails. A task that
succeeded in half a second for weeks and now takes forty is telling you something:
usually that a pattern is matching far more assets than it used to, or that a cache
has stopped rebuilding.
Use the 10m / 1h / 24h / 7d / 30d controls to change the window.
Double-click an error to see what it was
The Errors trend is not just a count. Double-click a spike on it and Stream
opens Logs already narrowed to that task, that moment, and errors alone:
the failure itself, in one gesture.
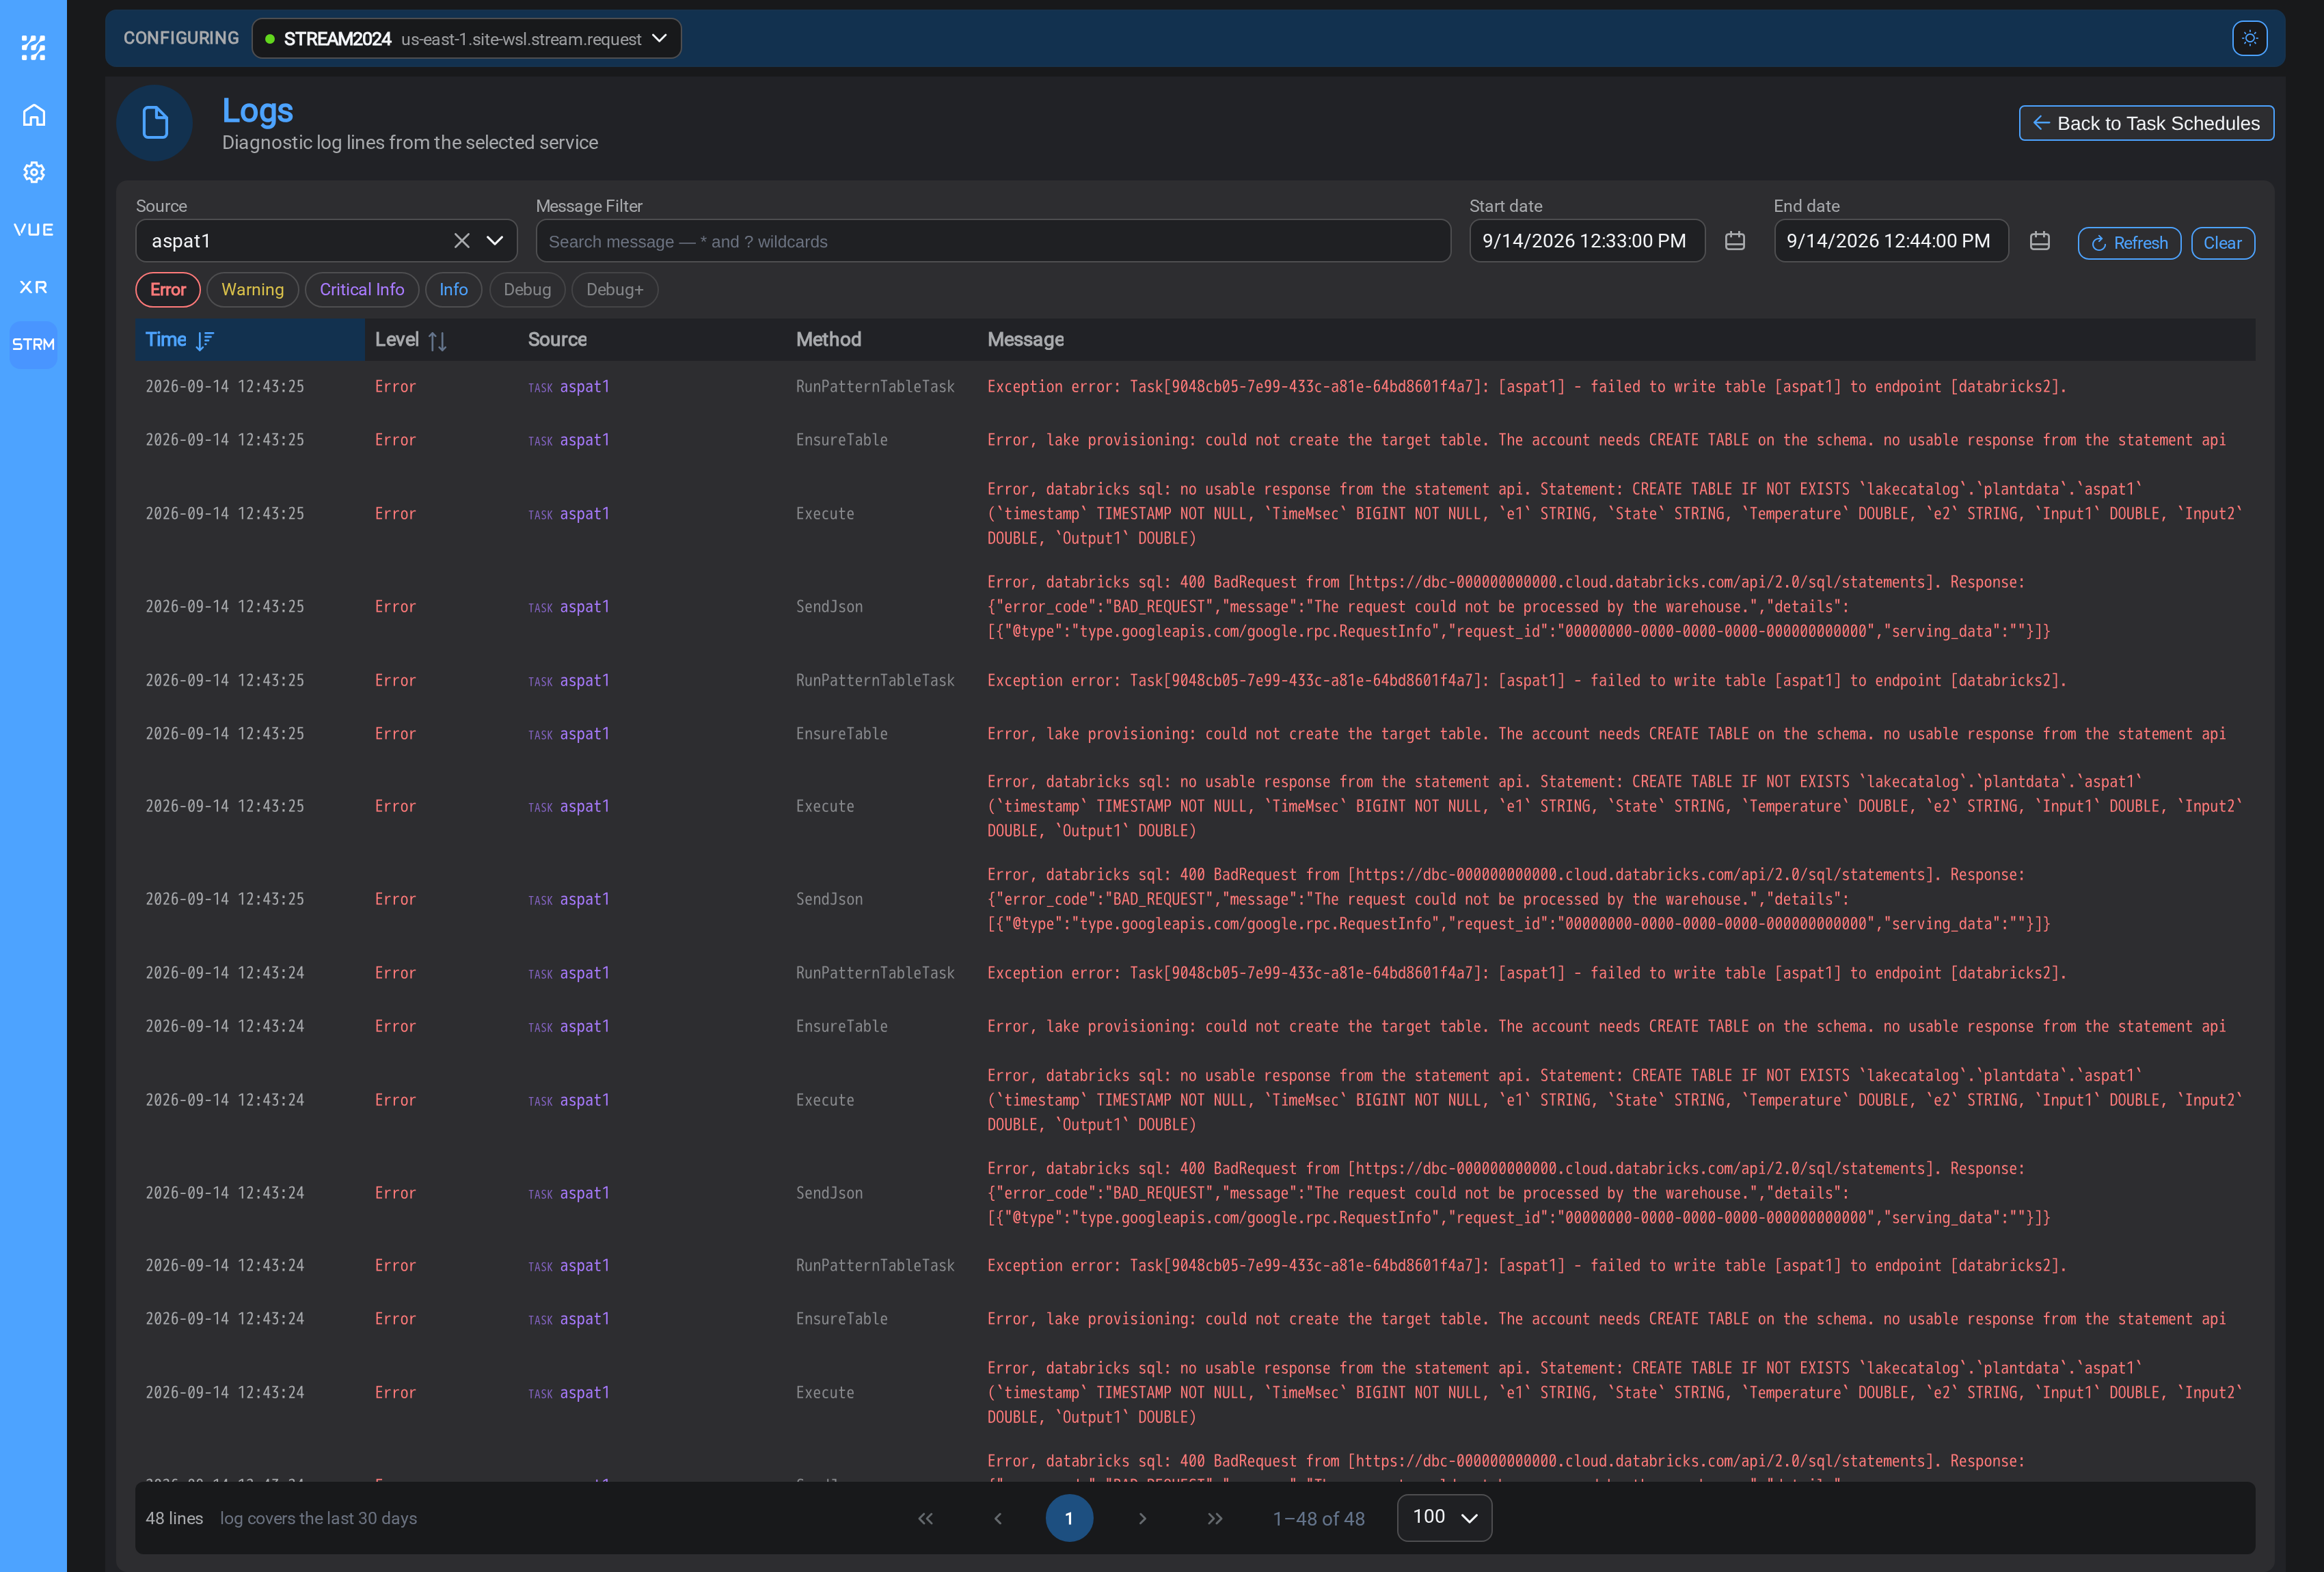
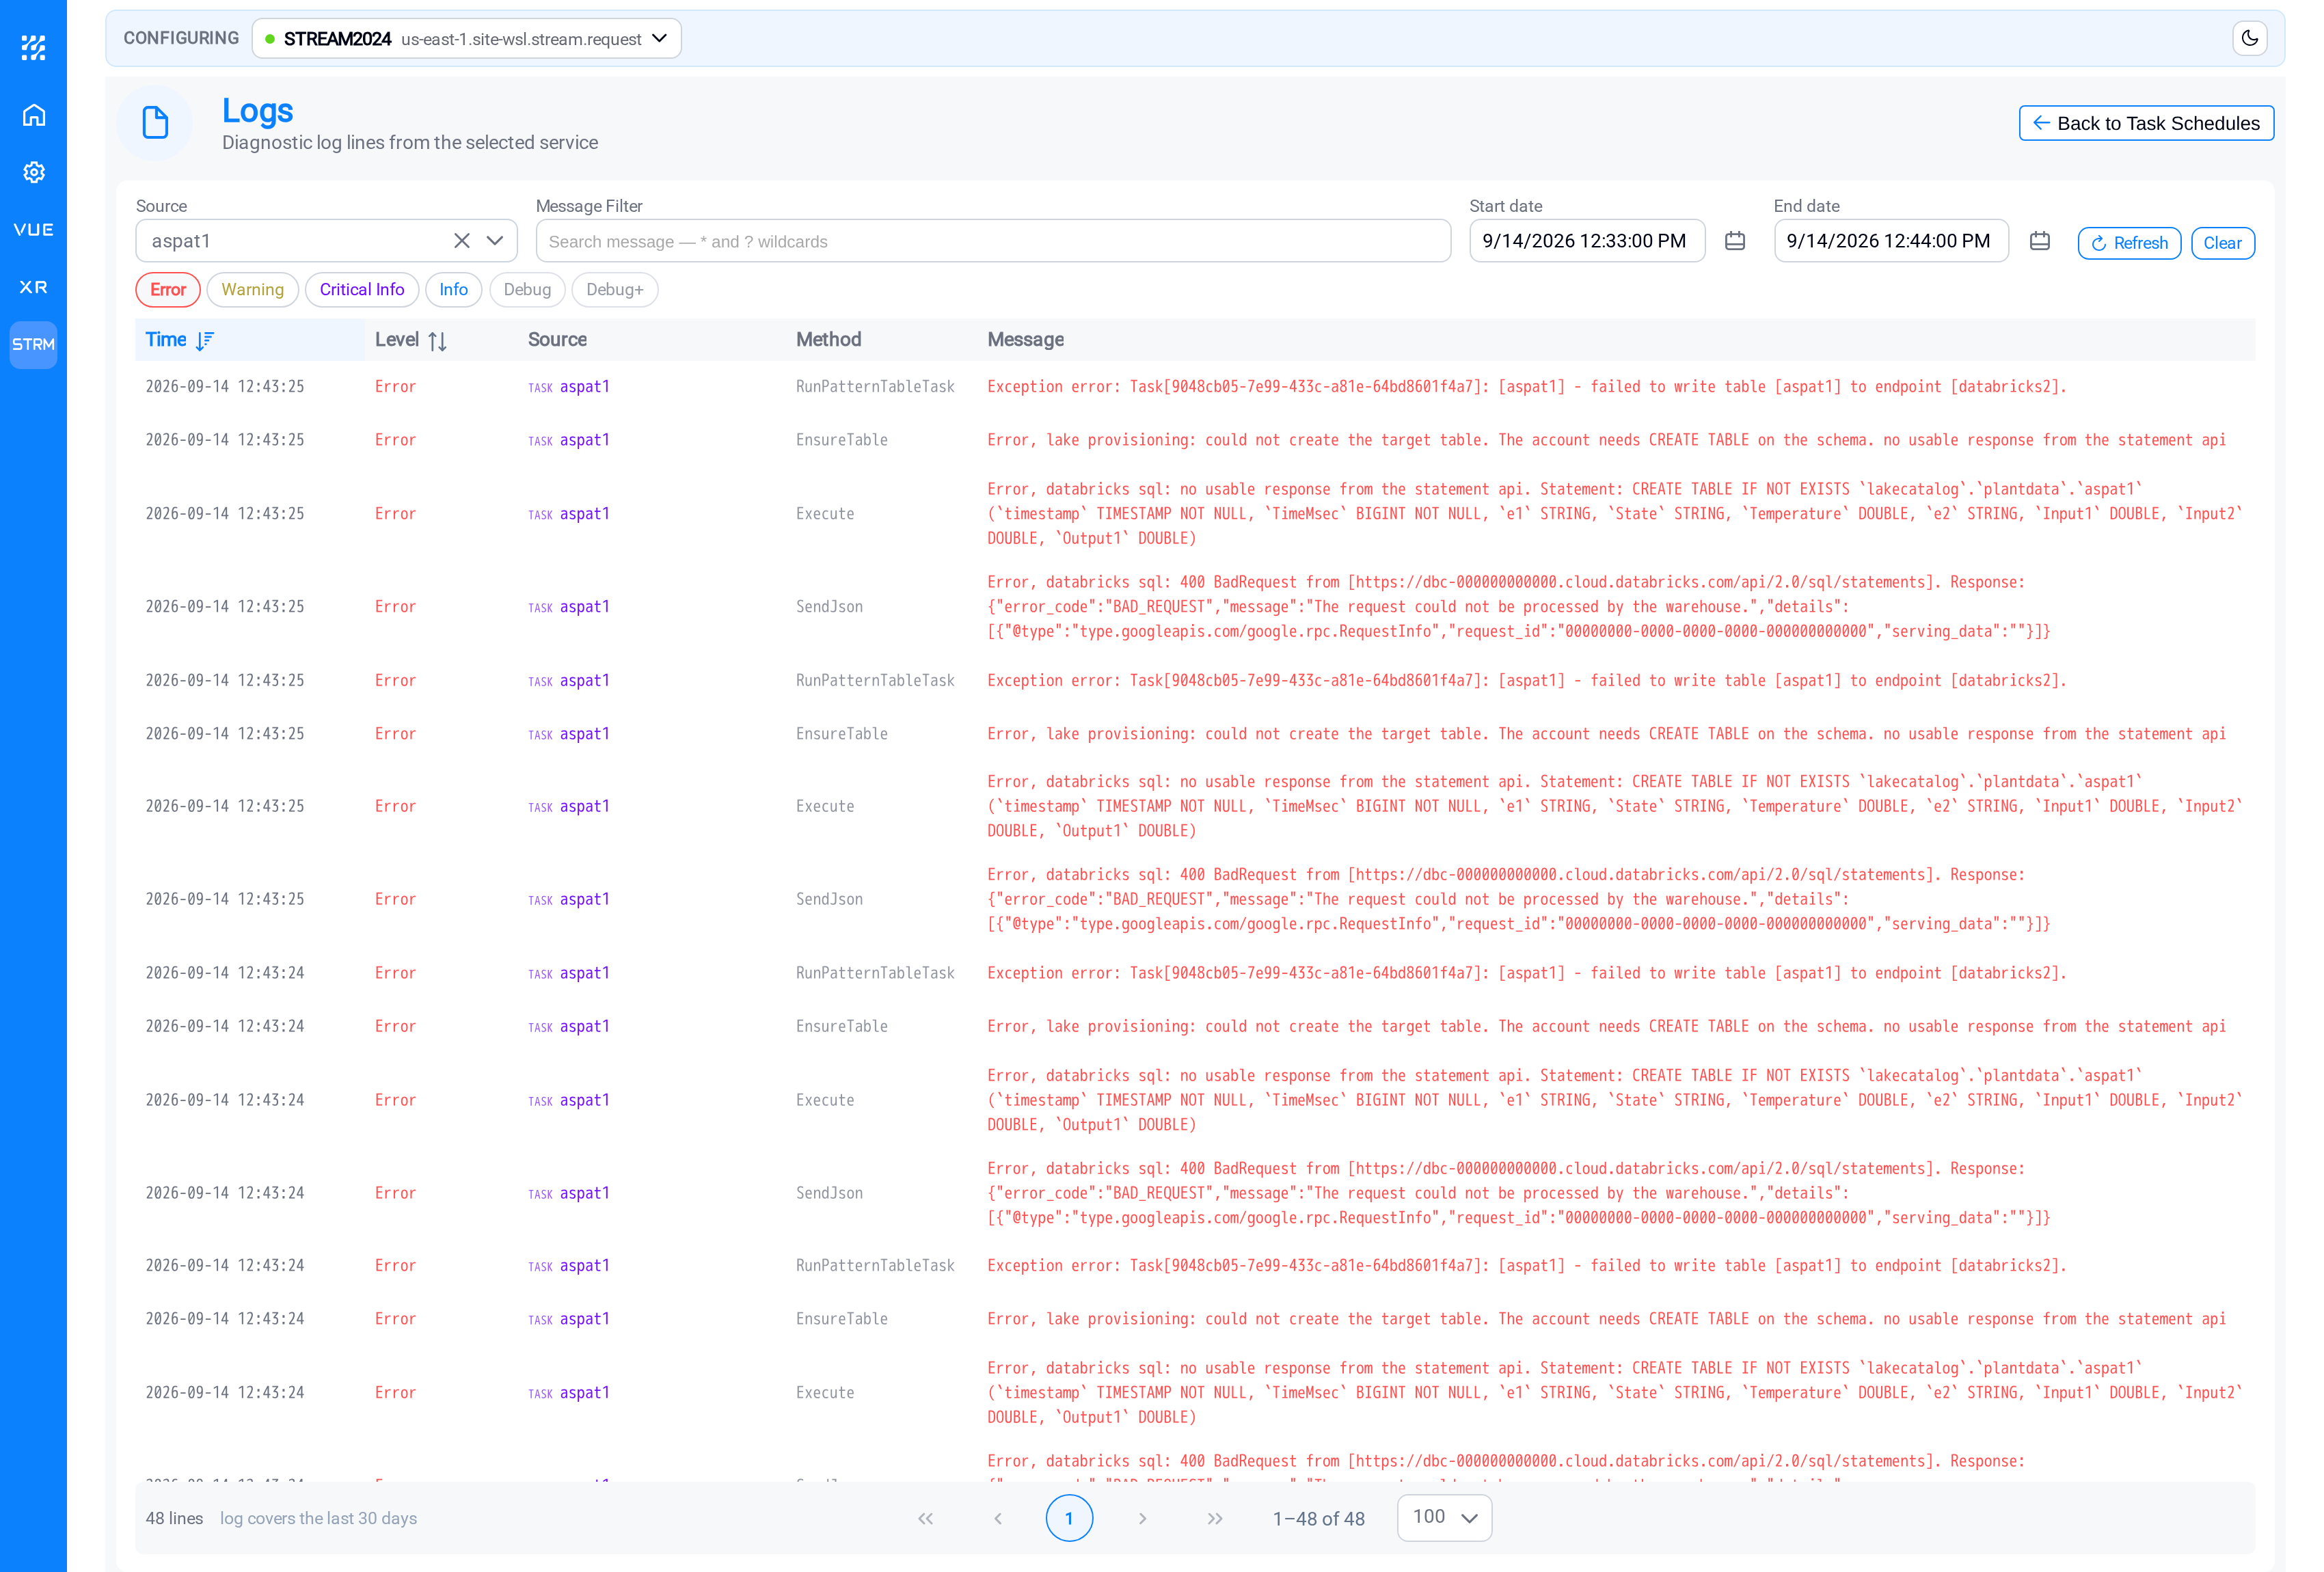
The alternative is opening Logs cold: picking the task out of the source list, guessing a time window wide enough to
contain the failure and narrow enough to be readable, then turning off the levels you
do not want. The spike already knows all three, so it fills them in.
The chart says so itself, its title reads Errors, double-click a point to see the
log.
The other three trends do it too
Every trend is the same shortcut; only the level filter differs. Here the same task,
reached from a point with no errors in it: the run messages around that moment
rather than the failures:
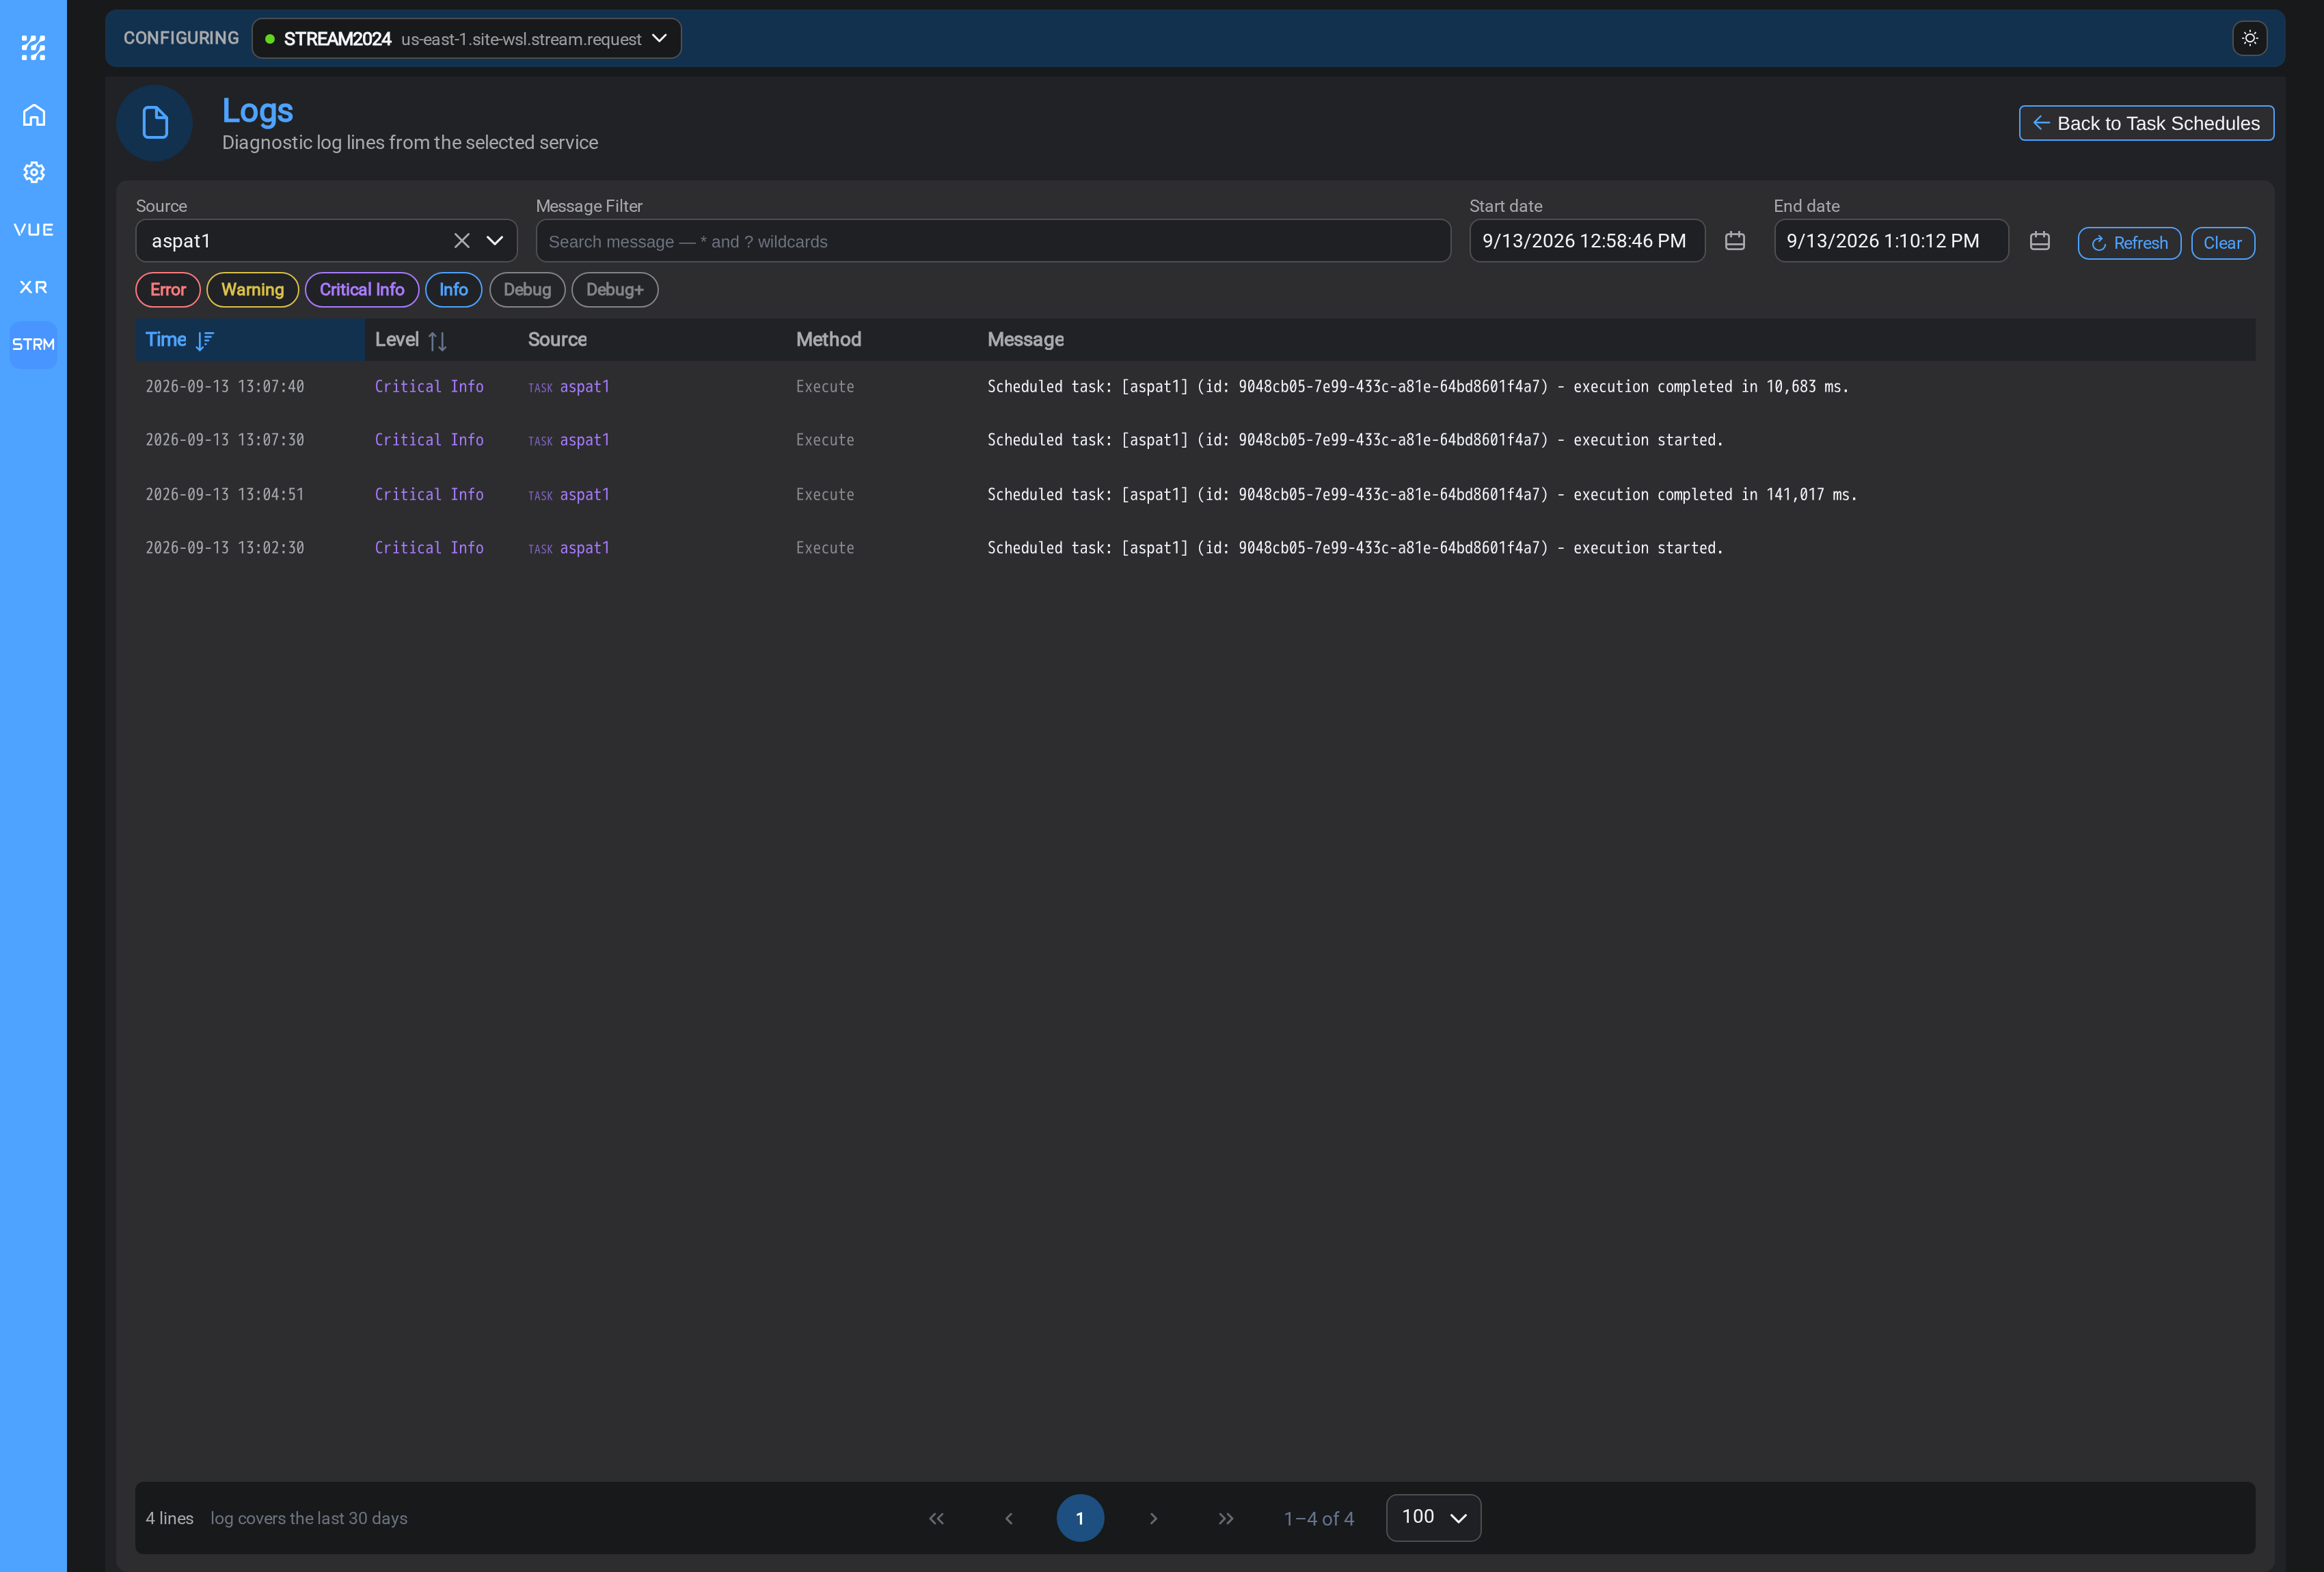
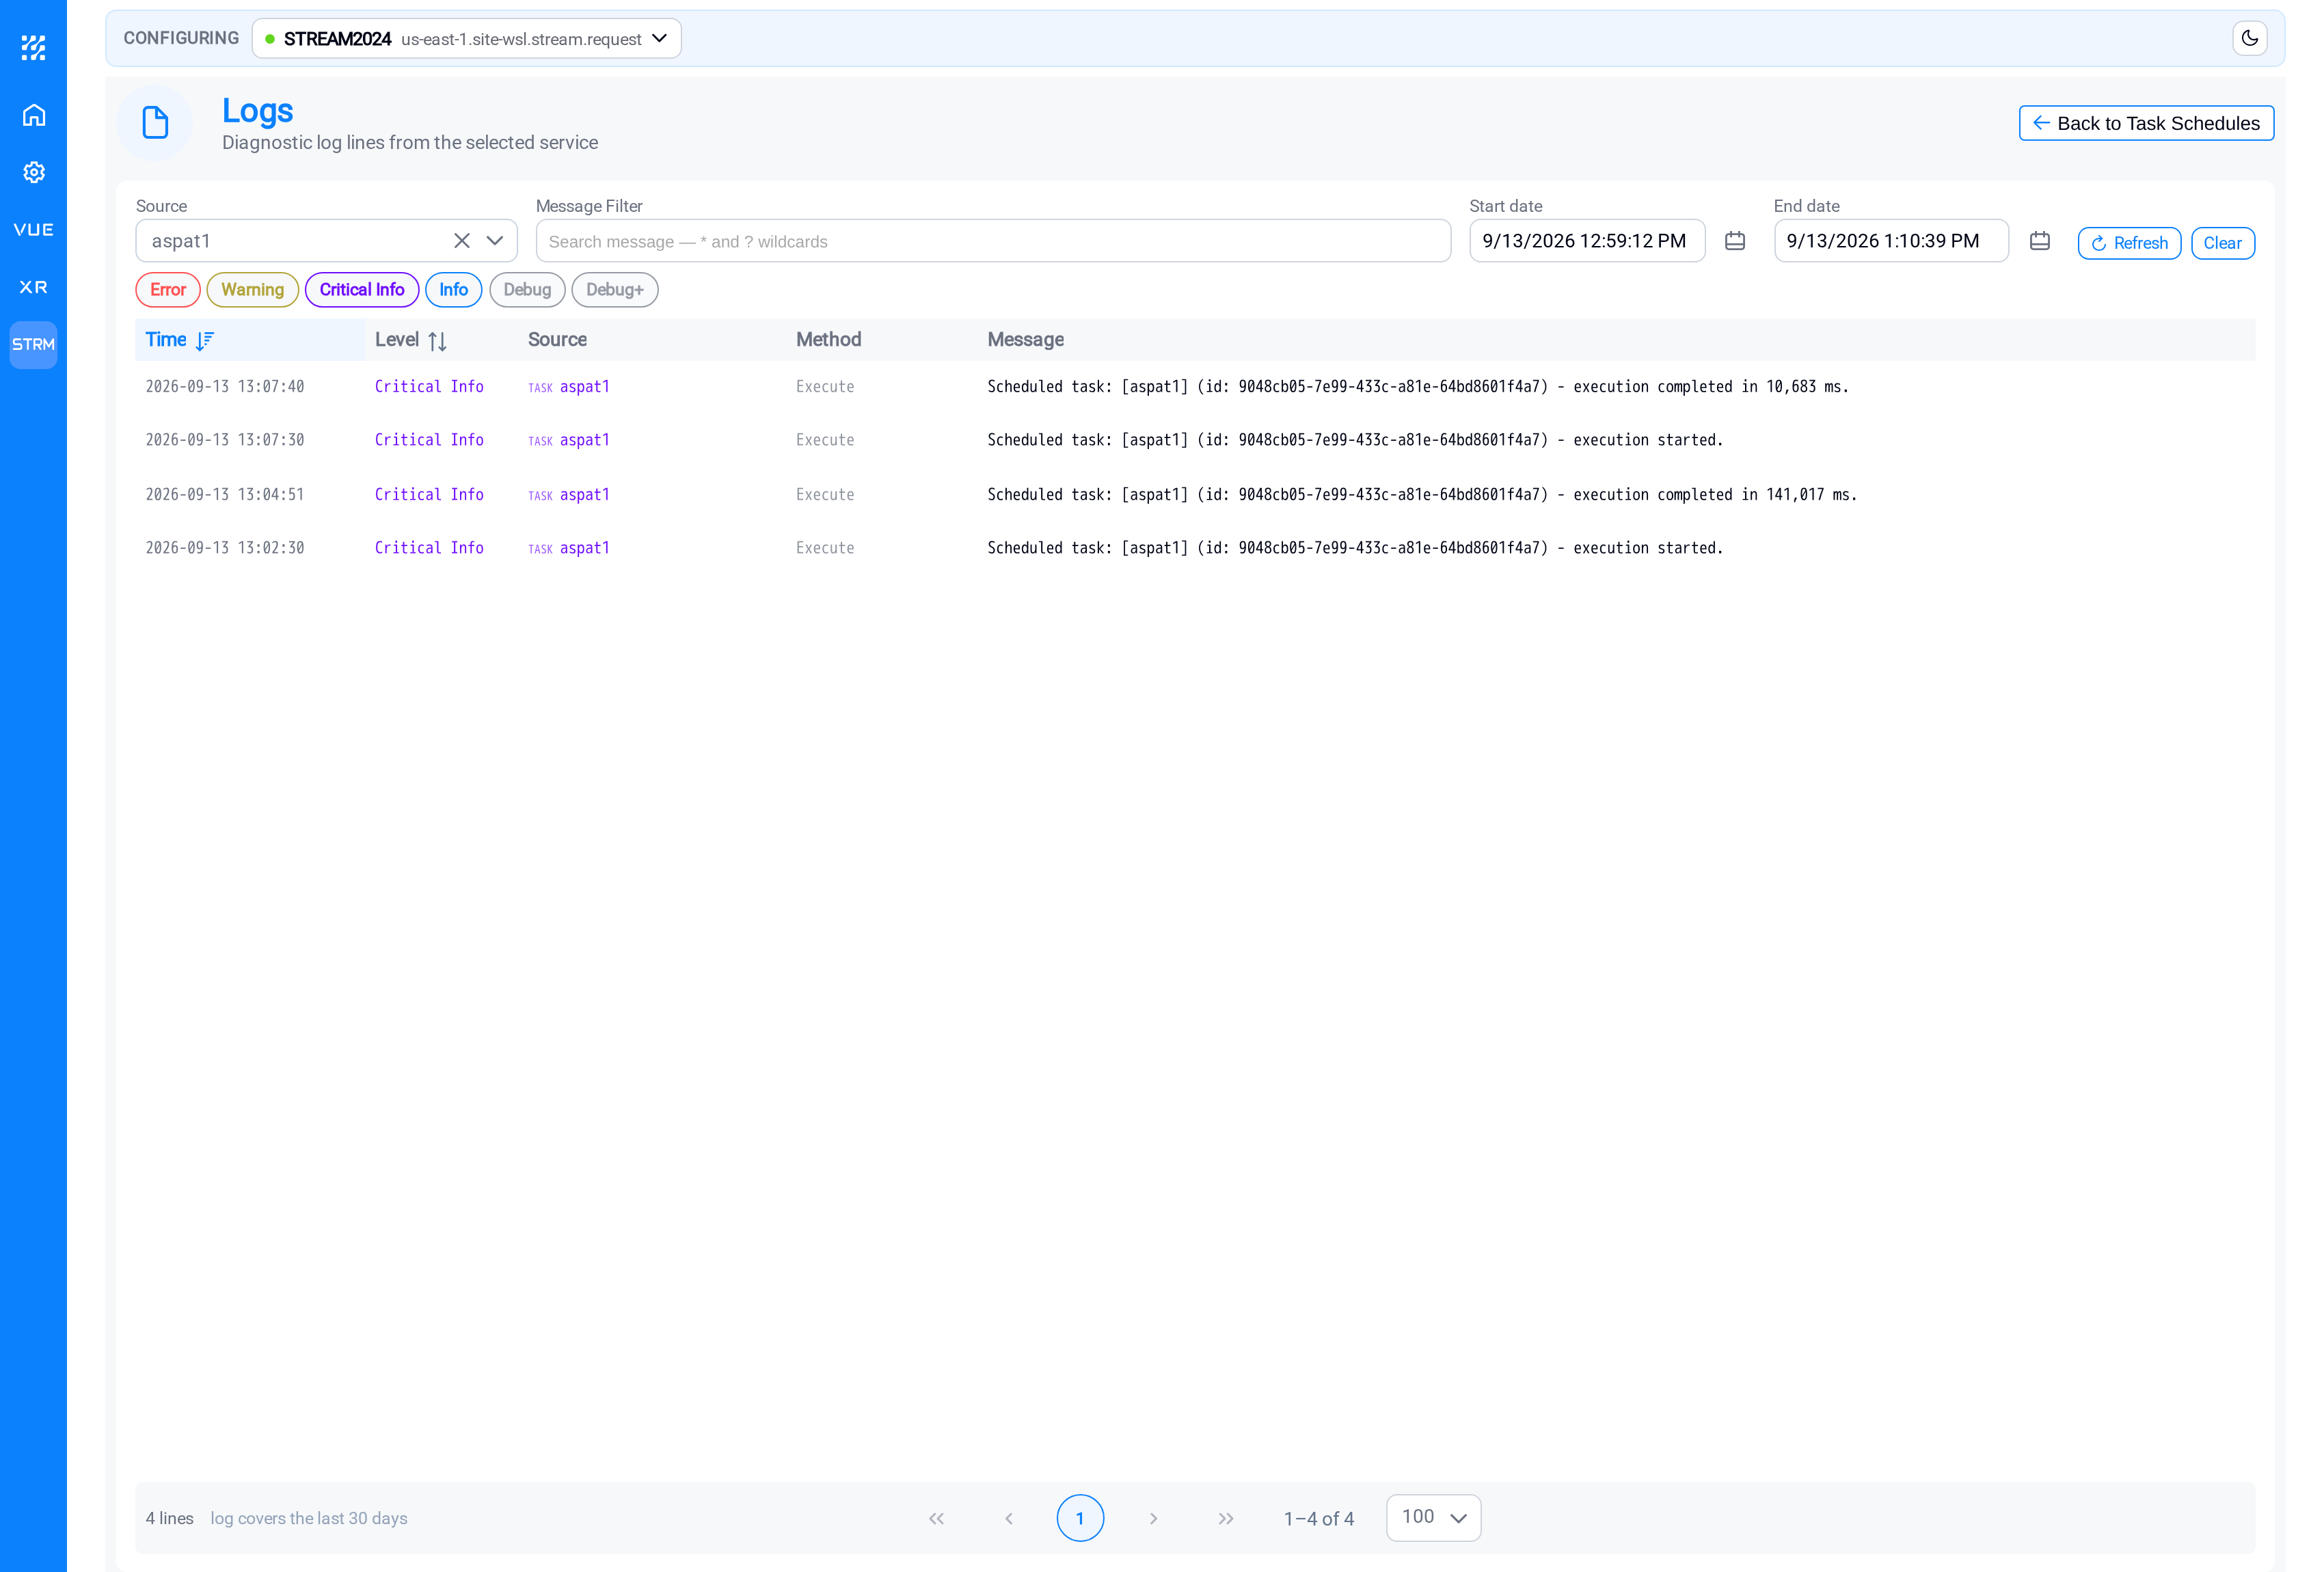
| Double-clicked | Source | Start / End | Level |
|---|---|---|---|
| A spike on Errors | The task | About eleven minutes around the point | Error alone |
| Any other trend, or a point with no errors | The task | The same window | The usual set: Error, Warning, Critical Info, Info |
The difference is the useful part. On an error you asked "what failed at 08:38?", so
you get the failures and nothing else. From Events read / rows written, Read /
write time or Execution duration you are asking what the task was doing. That
needs the ordinary run messages around it: the execution started andexecution completed in 10,683 ms lines, which say how long it took and whether it got
there at all.
Debug and Debug+ stay off either way. They are off by default everywhere, and the
drill-through does not turn them on.
Getting back
Back to Task Schedules, at the top right of the Logs page, returns you here. The
same row is still expanded and the same range still selected, so you can carry on
reading the trends where you left off. The link carries
that state with it, which is why it comes back rather than reloading a collapsed list.
Pausing and resuming
Pause a schedule before maintenance on either end: the PI System or the
destination, so runs do not pile up failures while a server is down. Resume it
afterwards.
A paused schedule does not queue the runs it missed. When you resume, it simply
starts again on its cadence.
Common problems
I set an earlier Data start and the task still only processes today.
Check that you chose From a specific time (override) and not From the
watermark, and that the save went through. An override is applied on save; a schedule
that refused to save has changed nothing. Note also that the Data
through column moves forward on its own as the task runs, so a column reading
"today" a few runs later is the watermark advancing normally, not the override being
ignored.
The schedule says Scheduled but nothing is being written.
The task is running and producing nothing. Its source is the likely cause; check
the pattern's Preview tab, and if the pattern is cached, whether the cache has been
rebuilt since the pattern last changed.
Runs are getting slower.
Look at the trend on the expanded row to see when it started. Then check whether
the pattern now matches more assets, or whether a cache that
used to exist has stopped rebuilding.
A run overlaps the next one.
If a task takes longer to run than its interval, runs will begin to overlap. Either
lengthen the interval or find out why the run is slow: overlapping runs against the
same destination are how duplicate rows appear.
The schedule shows Error every time.
Open Logs and filter to that task. The message will normally name the
endpoint or the value that failed.
What's Next
With a schedule running, the two pages you will use most are the diagnostic ones.
Continue to Logs →.
Related
- Tasks: the work a schedule runs
- Asset Pattern Cache: the same cadence controls, for patterns
- Logs: what happened on a given run