
Stream Guide
Stream Guide
Stream is an ETL tool for process data. It extracts readings from your PI System,
transforms them into something an analyst or a model can actually use, and loads the
result wherever the analysis happens: a database, a file share, a data platform.
Process data is three things, and Stream reads and writes all three:
| What it is | Where Stream finds it | |
|---|---|---|
| Time-series | Tags, channels and attribute values over time | PI points and AF attributes |
| Assets | The equipment hierarchy and its metadata | AF elements and attributes, found by patterns rather than by name |
| Time frames | The periods in which things happen: batches, unit procedures, phases, downtime | AF event frames, also found by patterns |
A task reads any combination of the three and aligns them in time. A Python
calculation and a conditions filter are optional. The result goes to a channel, a
table, a JSON document or a data lake, once, on a schedule, or continuously in near
real time.
Reading is a PI System only; every other endpoint type is a destination. See
Endpoints.
Those three words are the composer's Sources row, so the definition and the console
say the same thing.
You describe the assets you care about, say what should be calculated or copied,
choose where the results go, and set how often it runs. Stream then does it
unattended, and keeps a record of every run.
Why it exists
Ask anyone who works with industrial data where their time goes, and the answer is
rarely the analysis. It is the preparation: the rule of thumb people quote is that
80% of the effort goes into getting data into the proper shape, and only the last
20% into analyzing it.
Process data earns that reputation. It arrives from instruments that were never
coordinated with each other:
| The problem | What Stream does about it |
|---|---|
| Every sensor reports on its own rhythm: one every two minutes, one every five, a lab result twice a shift | Time Alignment decides when a row exists and what each channel contributes to it |
| Raw scans are too dense to analyse, or too sparse to align | Interval mode resamples onto a regular grid |
| Readings arrive late, out of order, or mid-calculation | The offsets decide how long to wait and what is safe to write |
| The number you need is not a number anyone records | Calculations derive it, in Python, with numpy and pandas available |
| The destination wants columns and types, not tags | Mapping shapes each row into a table or a JSON document |
| It all has to happen again tomorrow, unattended | Task Scheduler run it, and Logs and Audit record what happened |
Do that once, in one place, and the preparation stops being a task anyone repeats.
What reaches your analytical platform is already normalised, already on a common
timebase, already calculated, and it keeps arriving that way.
Why it scales
What makes it worth setting up is scale. Suppose you want to know how ambient
temperature affects oil production across a field of a thousand pumps. The
temperature comes from a weather station, the production from each pump: two
different assets that have to be read together. In Stream you describe that
relationship once, write the calculation once, define the output table
once, and it runs for all thousand pumps. Commission pump 1001 and it is
included on the next run, with nothing to edit.
The five things you configure
Stream has five building blocks, and they stack in one direction. Each one uses
the one before it, so this is also the order you build them in.
| Block | What it is | Why it exists |
|---|---|---|
| Endpoint | A stored connection: a PI System to read, a folder or database to write | So credentials live in one place instead of inside every task |
| Pattern | A description of assets and how they relate: "a weather station, and each pump beneath it" | So one definition covers every combination in the plant, and keeps working as assets are added |
| Pattern cache | A stored copy of a pattern's matches, refreshed on a cadence | So a task does not have to re-search the whole hierarchy every time it runs |
| Task | The actual work: what to read, whether to calculate, where to write | This is the job itself |
| Schedule | How often a task runs | So it happens without anyone starting it |
You do not need all five for every job. A task that reads a handful of named tags
needs an endpoint and nothing else before it. But anything that works across many
assets will use a pattern, and anything that uses a pattern across many assets
will run better with a cache.
Checking that it is all working
Stream opens on its Dashboard, which is the one page that answers "is everything
healthy?" without you naming a task.
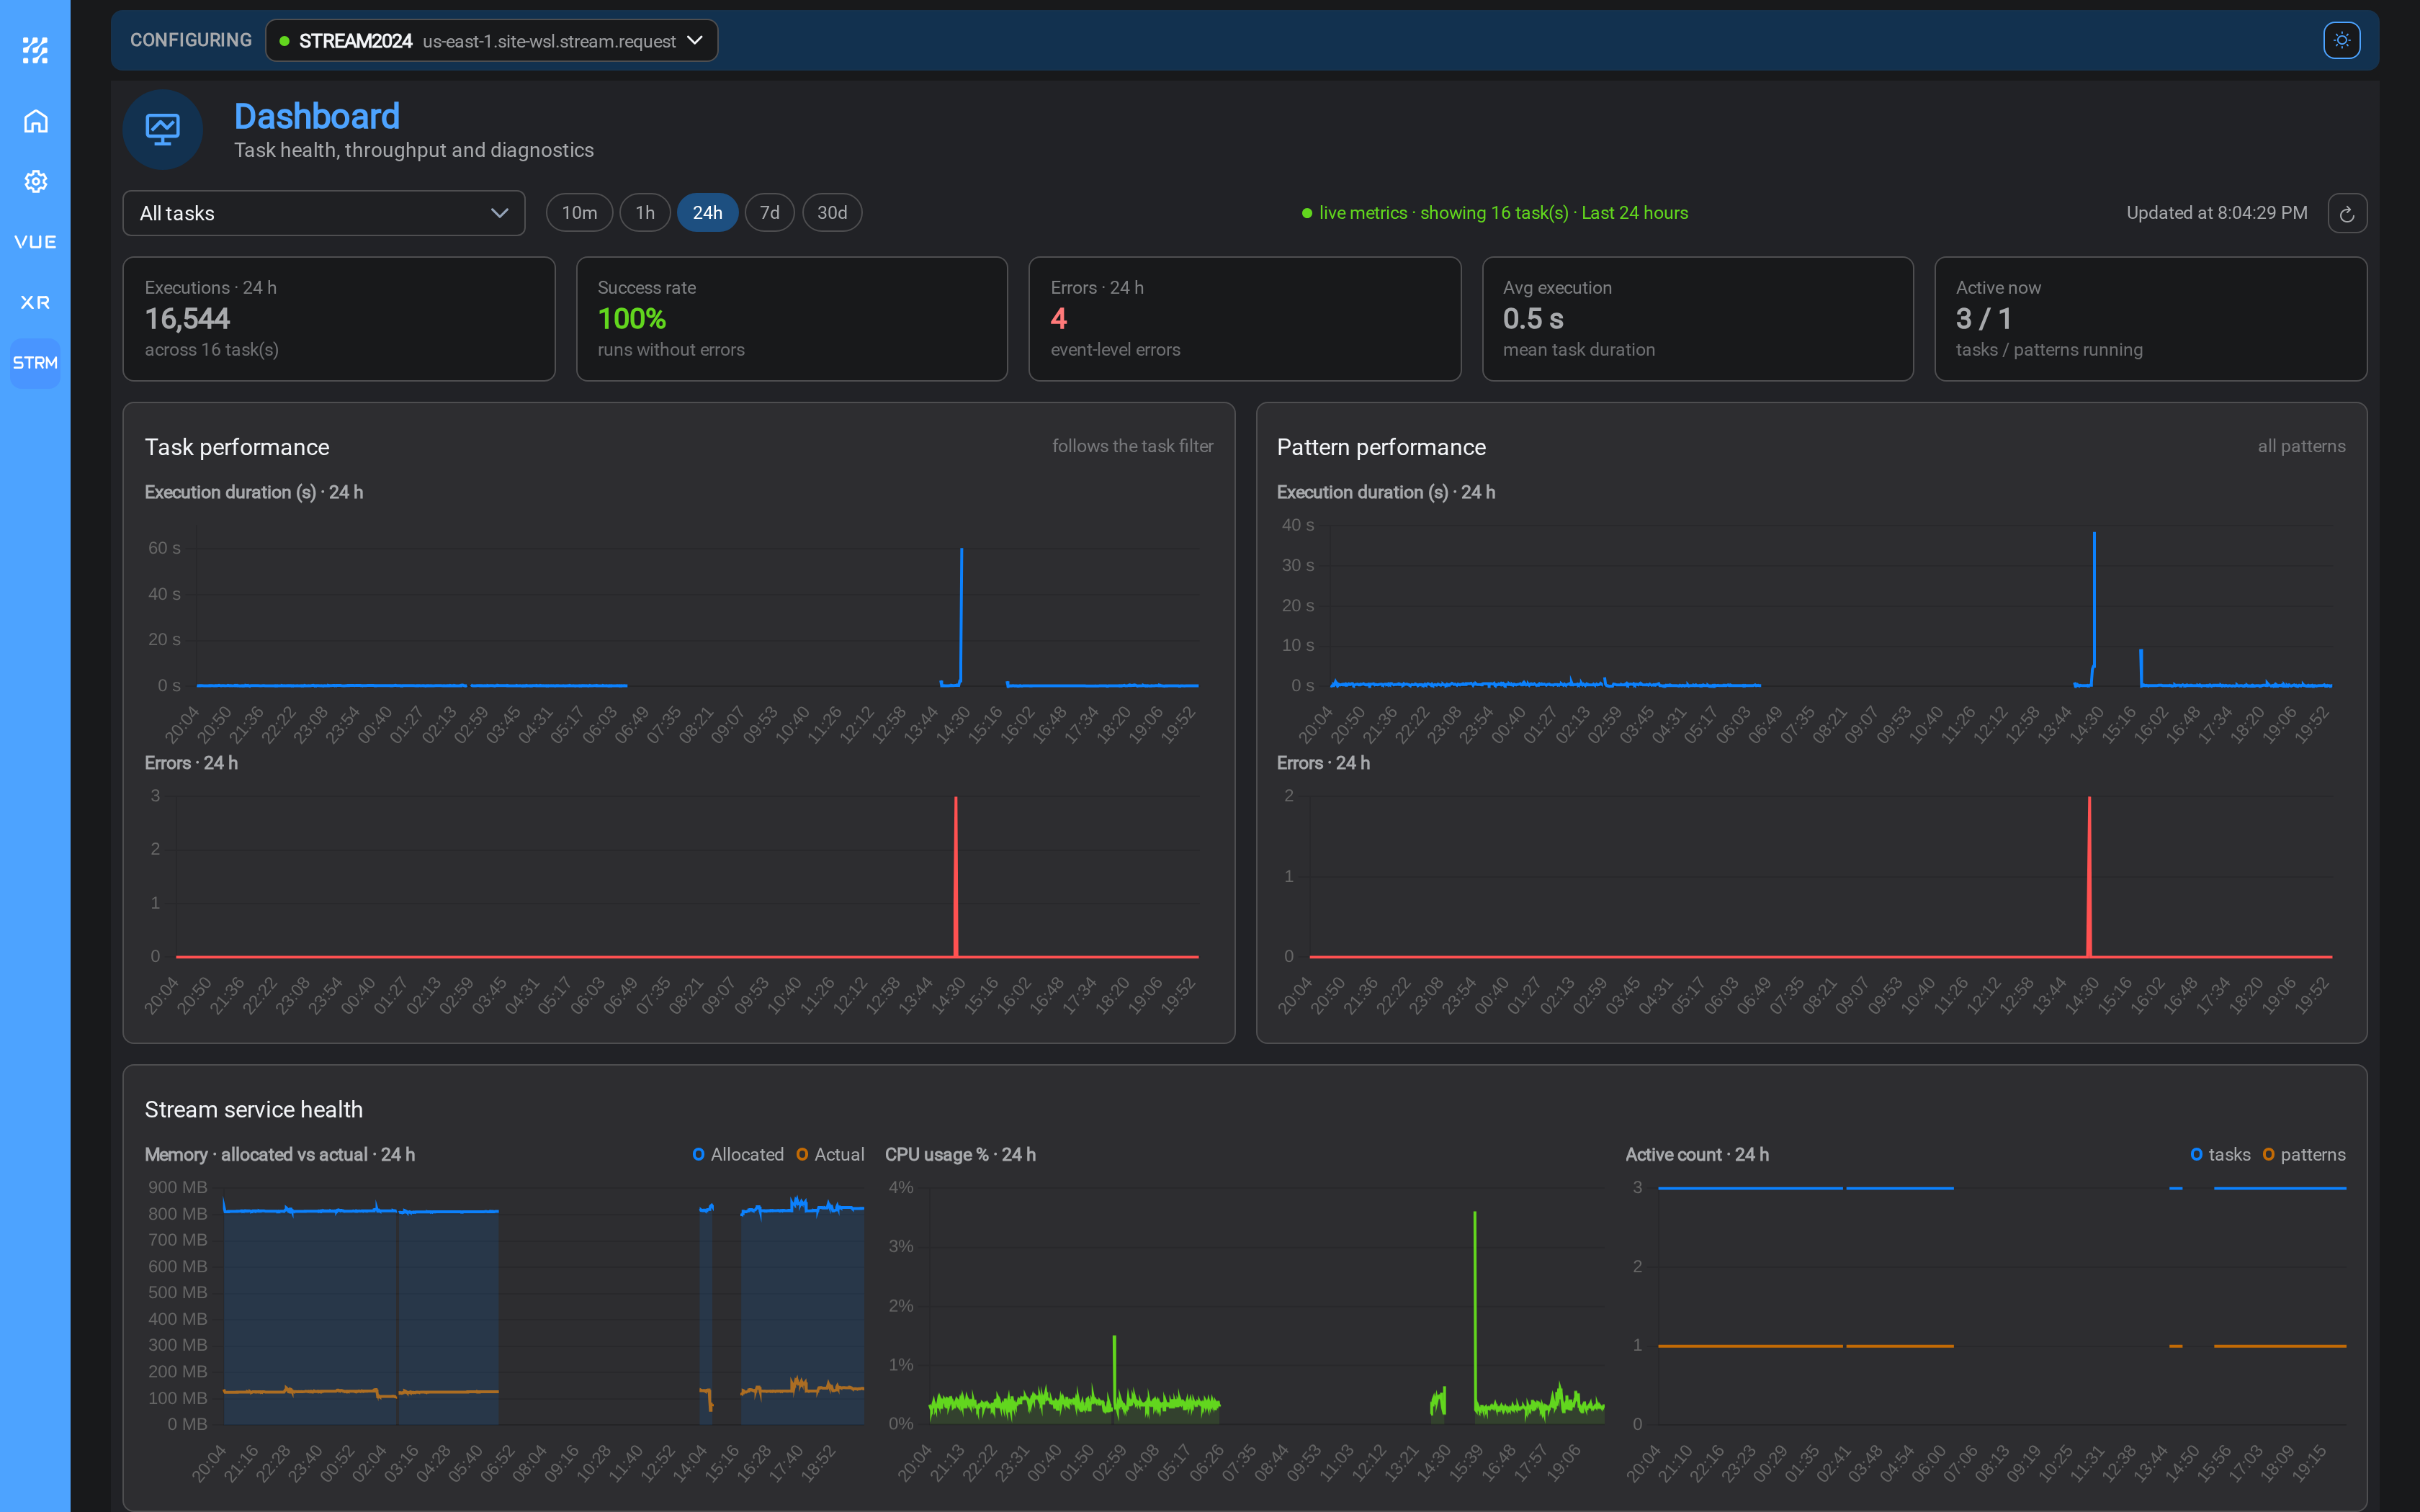
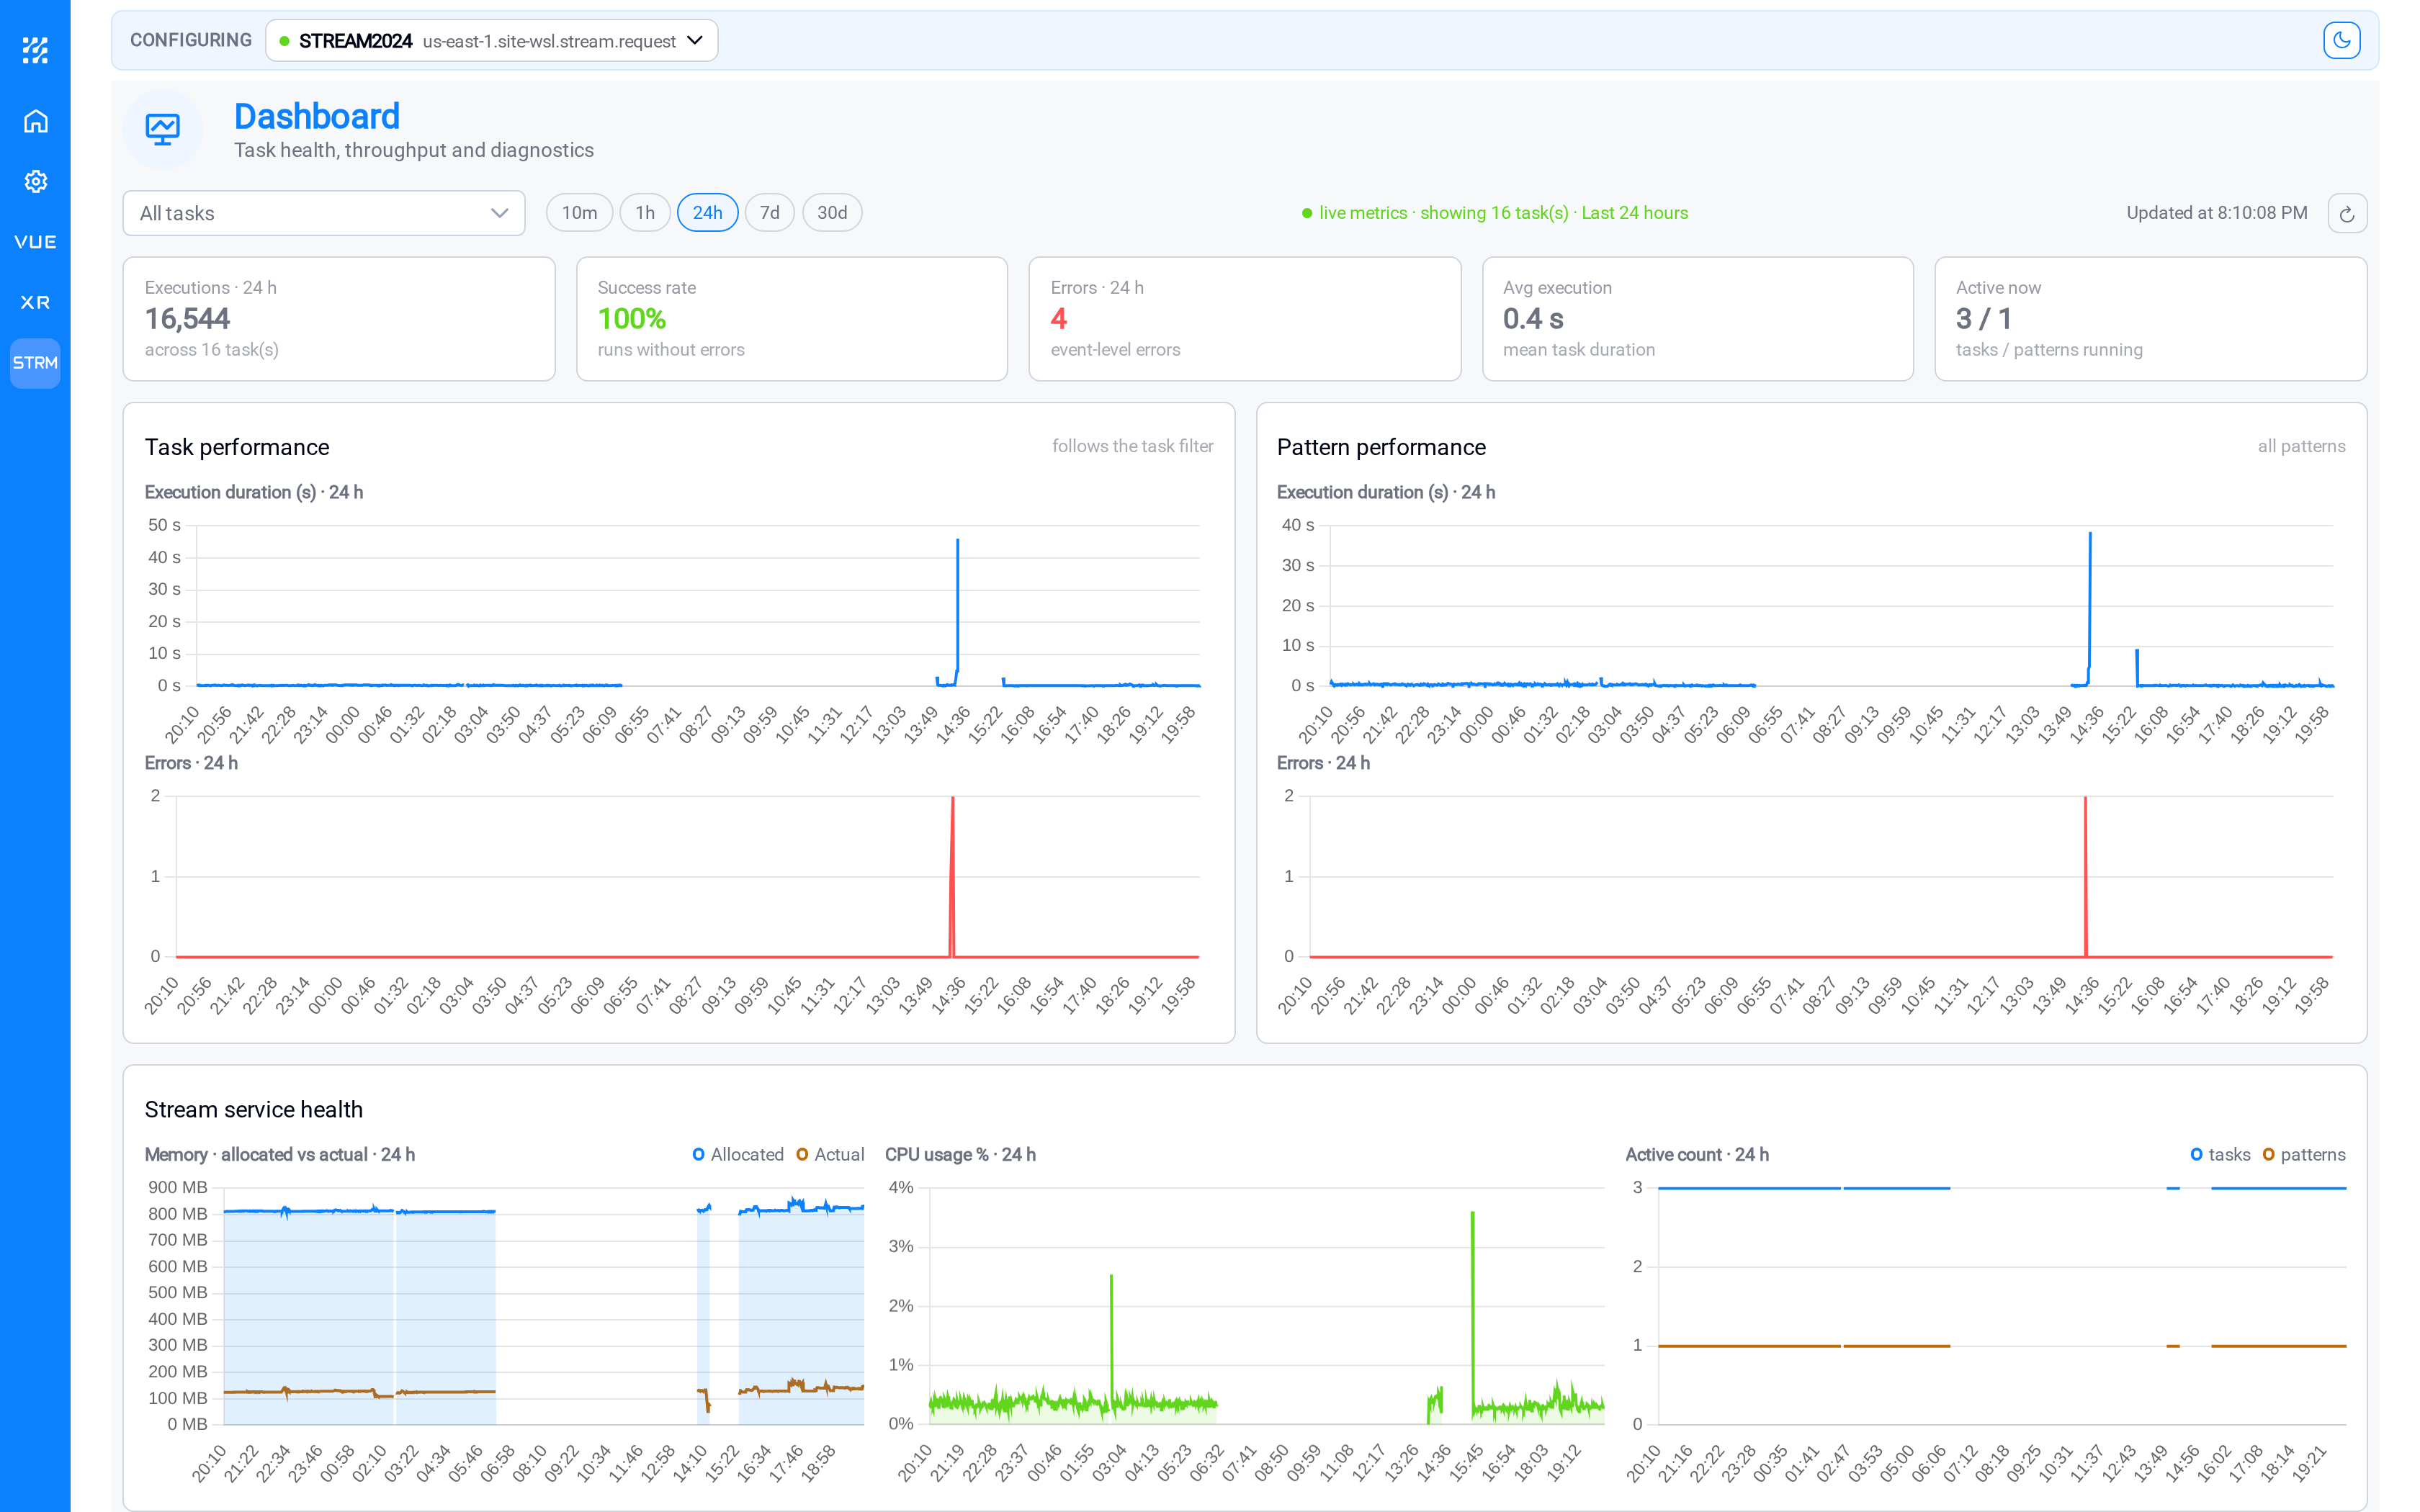
The figures across the top cover the period you select: executions, how many
succeeded, how many errors, average run time, and how many tasks and patterns are
running right now. Underneath, the charts separate task performance from pattern
performance, and the bottom row shows the Stream service's own memory and CPU.
Two habits make this page useful rather than decorative:
- Read the success rate against the error count, not on its own. A success rate of
100% with a non-zero error count means individual events failed inside runs that
otherwise completed: worth a look in Logs. - Watch average execution time over 7 or 30 days. A gradual climb is the earliest
warning that a pattern is matching more than it used to, or that a cache has
stopped refreshing.
Use the task filter and the time-range controls to narrow it down, and
Logs or Audit when you need the detail behind a number.
Where to find Stream
Stream is its own section, reached from the STRM button in the left-hand
application rail. If you do not see it, Stream is not enabled for your account:
ask your administrator.
Every page in the section sits under a ribbon showing which Stream service you
are configuring:


This matters more than it looks. A site can run more than one Stream service, and
everything you create (endpoints, patterns, tasks), belongs to the one named
here. If your endpoints are missing, check the ribbon before you check anything
else: you are probably looking at a different service. Use the dropdown to switch,
and use the ☾ control at the right-hand end to switch between the light and dark
appearance.
Related
- Data Sources: the drivers that connect IOTA Vue to your process data
- Administration Page: where feature access and user permissions are managed