
Time Alignment
Time Alignment
Process values do not arrive on a tidy schedule. One sensor reports every two
minutes, another every five, a lab result lands twice a shift. The moment you read
two of them together you have to answer a question the data does not answer for
itself: when a row is produced, and what value each channel contributes to it.
That is all Time Alignment does. It decides the rows: how many, at what
timestamps, before any calculation or mapping runs.
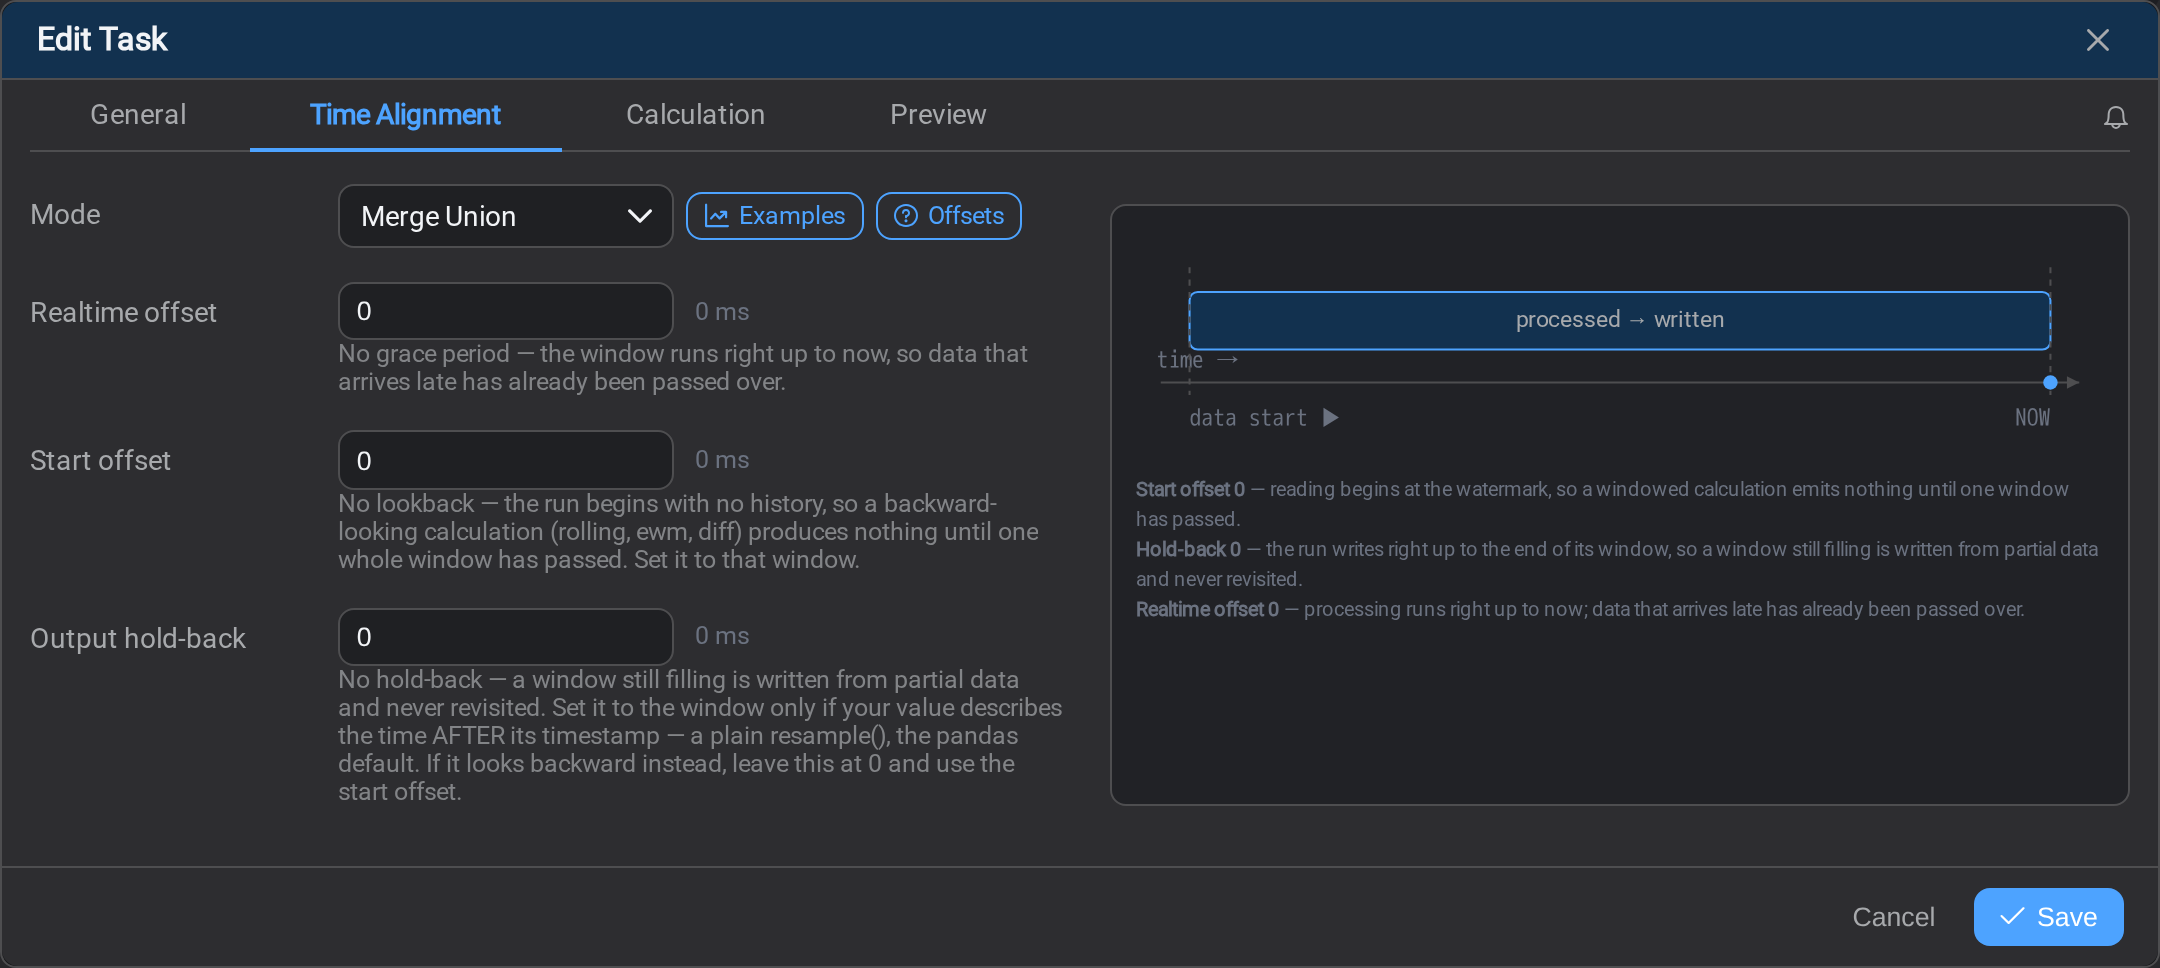
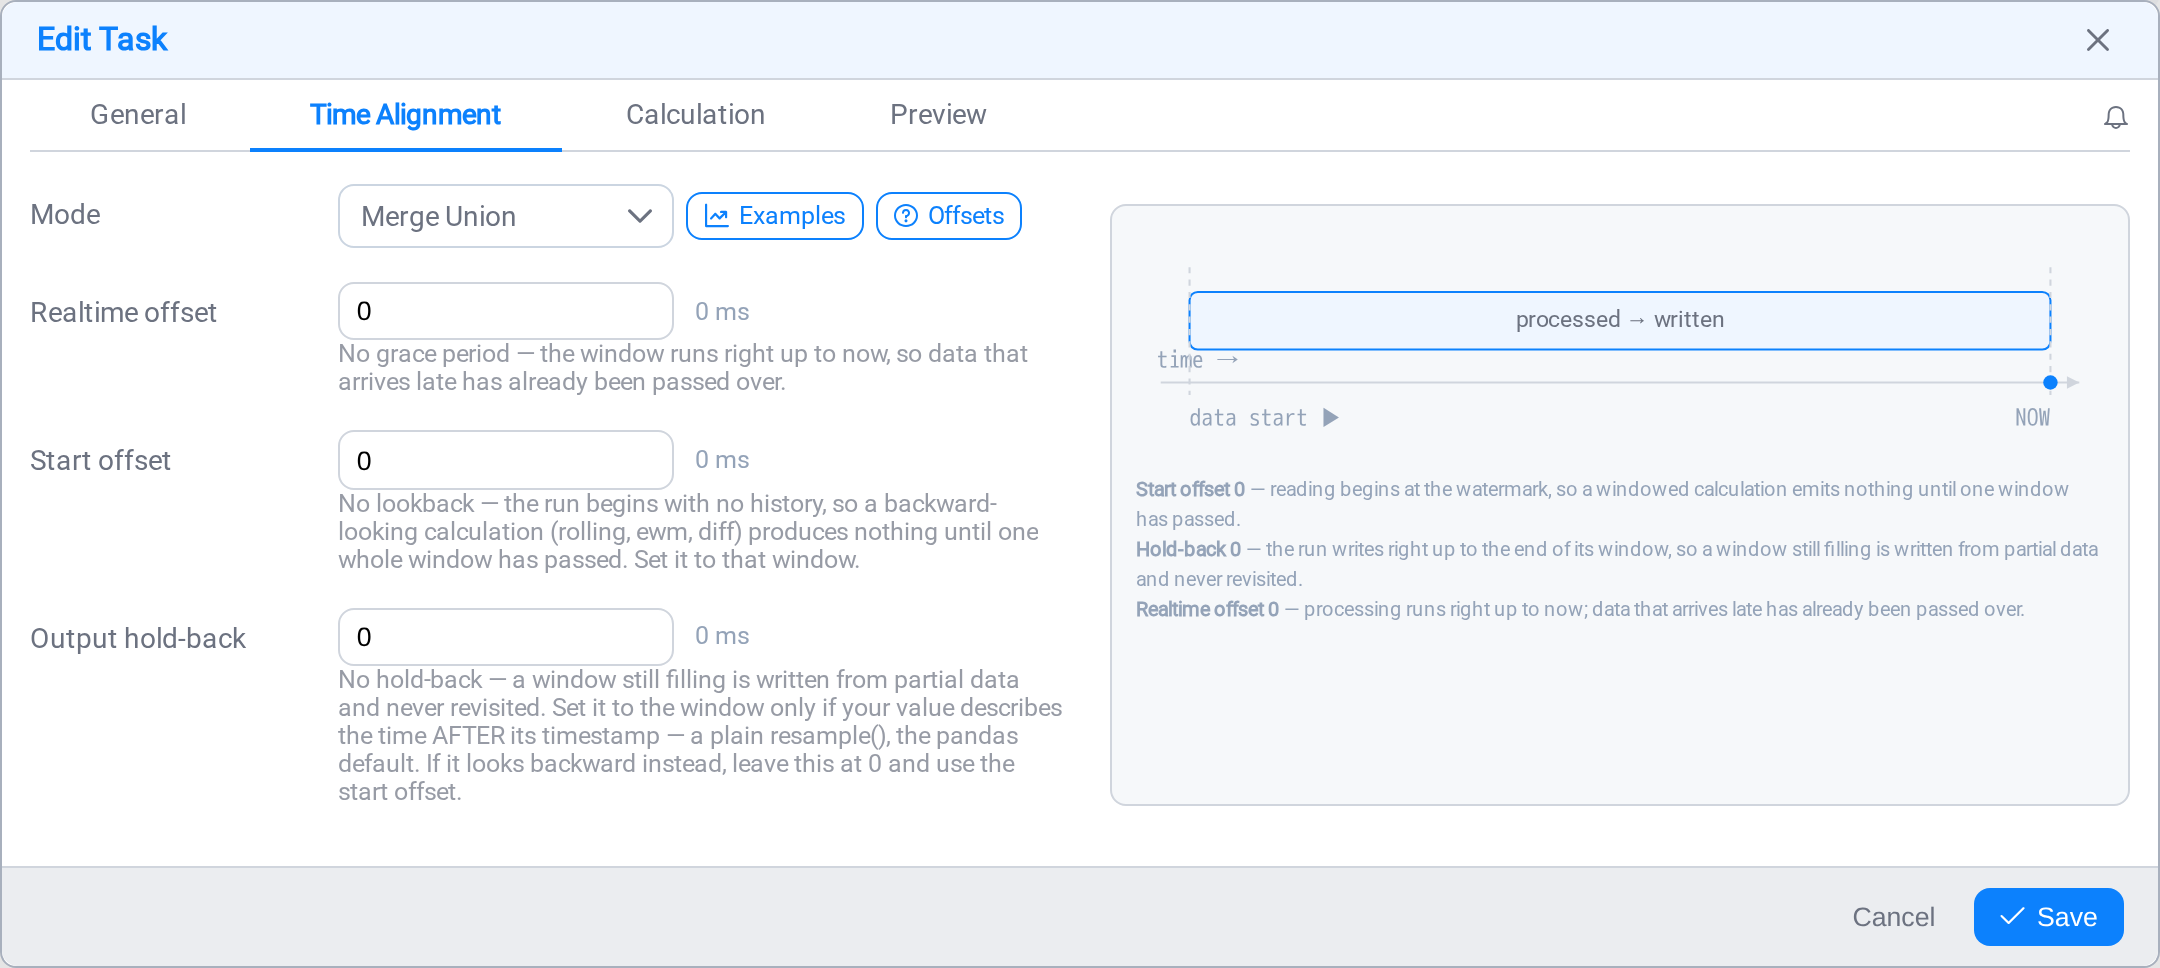
The Mode is the main decision. Alongside it sit the offsets, which shift the window
the task reads and the part of the result it is willing to write, and, for large
runs: the paging settings.
Choosing a mode
Five modes. They differ in one thing only: what triggers a row.
| Mode | A row is produced… | Rows from the sample below |
|---|---|---|
| Merge Union | at every event from any channel | 17 |
| Merge Align | only when every channel has a new event | 3 |
| Interval | on a fixed time grid, whatever the events did | 6 |
| Keys | at the timestamps of one nominated channel | 4 |
| Snapshot | once per scheduled run | 3 |
Those counts are the same three channels over the same 24 minutes. The mode you pick
changes the volume of output by more than five to one. Check it before a task runs
against a thousand assets.
The Examples button on the tab opens a worked illustration of all five against
the same three sample channels, with your current mode highlighted. The figures below
come from it.


| Glyph | Meaning |
|---|---|
| Filled dot | An event: the channel actually reported a value here |
| Large ring | That event is the fresh value used for this row |
| Small ring | The value is carried forward: the channel did not report, so its previous reading is reused |
| Diamond | The value was sampled or interpolated onto a timestamp the channel never reported at |
| Triangle on the axis | A row produced |
Counting the triangles along the bottom of each figure tells you how many rows that
mode would produce from the same data. That is the fastest way to see the difference
between the modes.
Merge Union: a row at every event
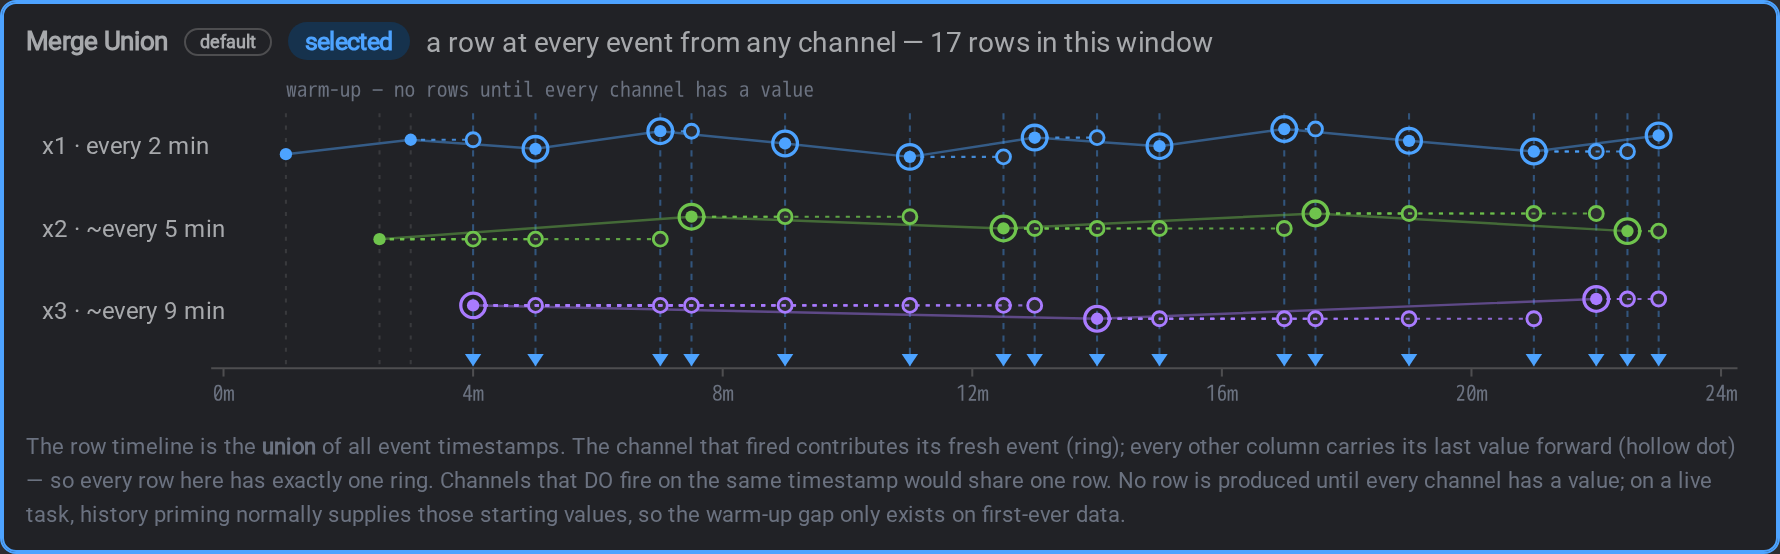
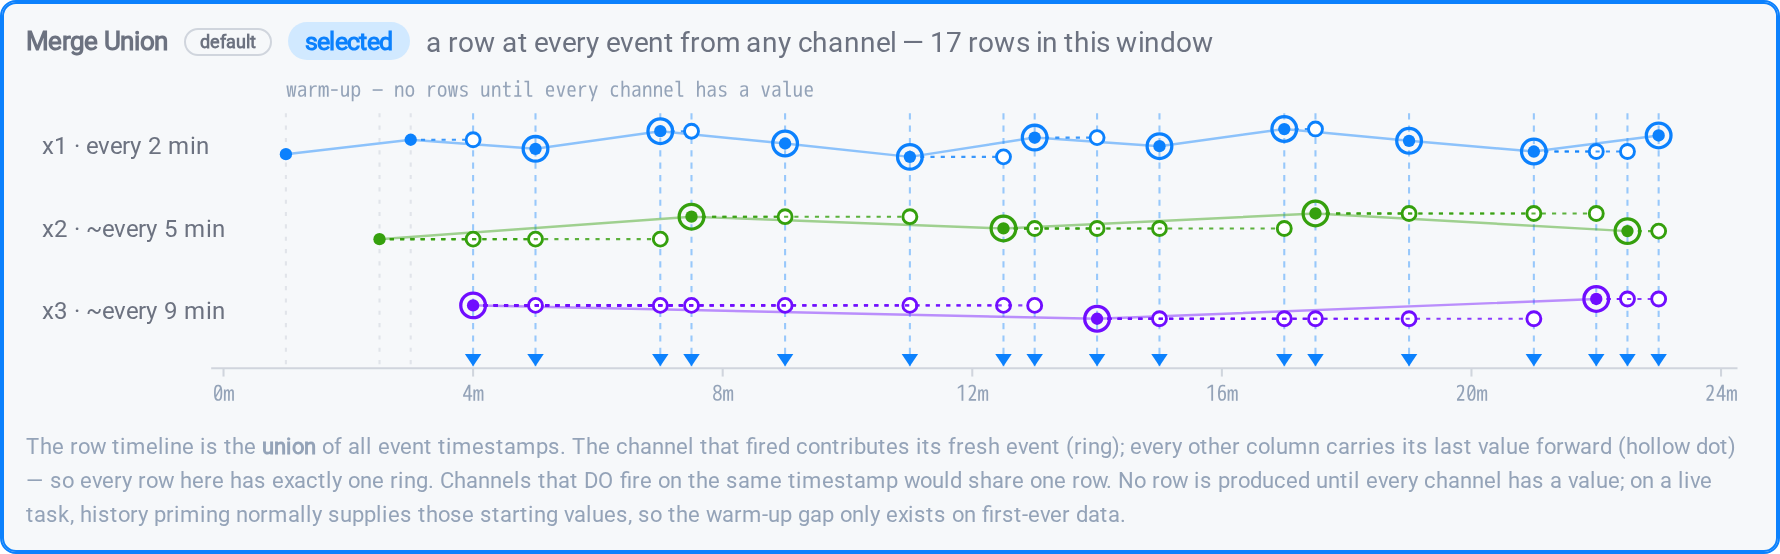
Every event from any channel makes a row. The channel that fired contributes its
fresh reading; every other column carries its last value forward. Seventeen events
across three channels gives seventeen rows.
Use it when you want to lose nothing. No reading is averaged away or skipped.
The cost is repetition. A slow channel's value is repeated on every row a fast
channel triggers, so a table of a thousand assets grows quickly and most of what it
holds is unchanged values. Good for a faithful record, wasteful as an analysis input.
No row appears until every channel has a value: the warm-up gap at the left. On a
live task, history priming normally fills those in, so you only see it on first-ever
data.
Merge Align: a row only when everything is new
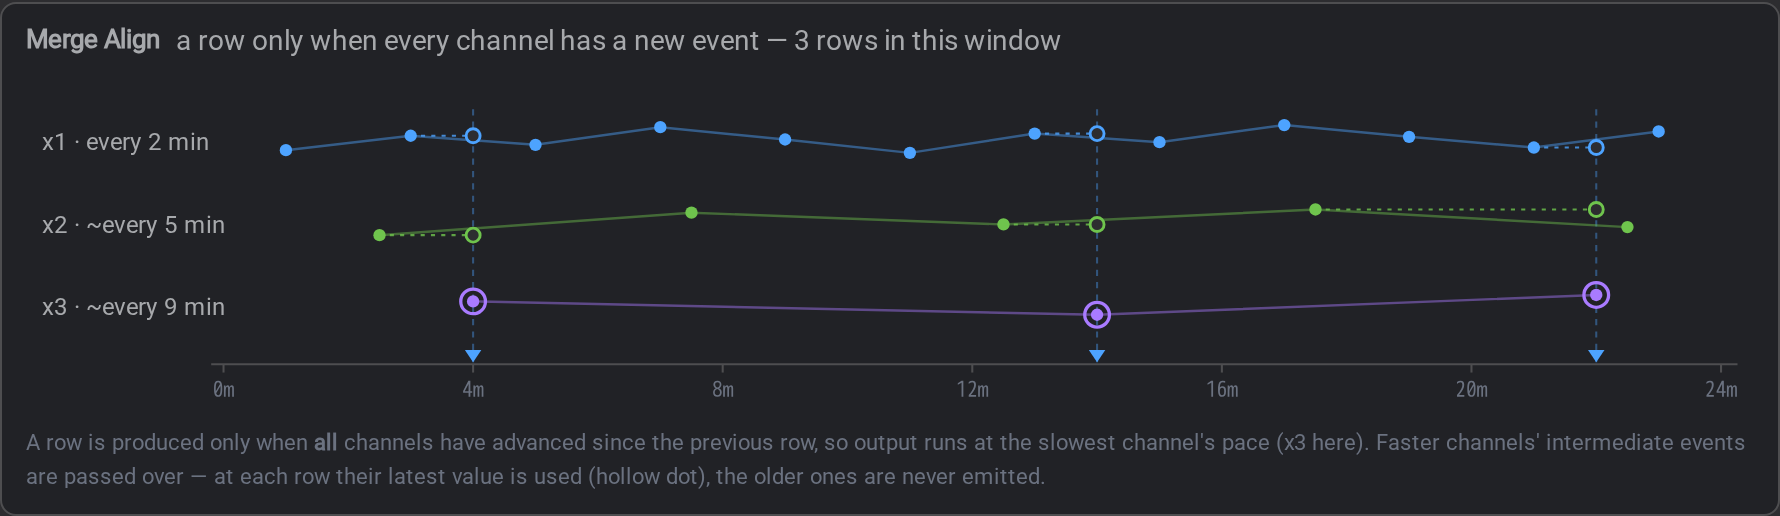
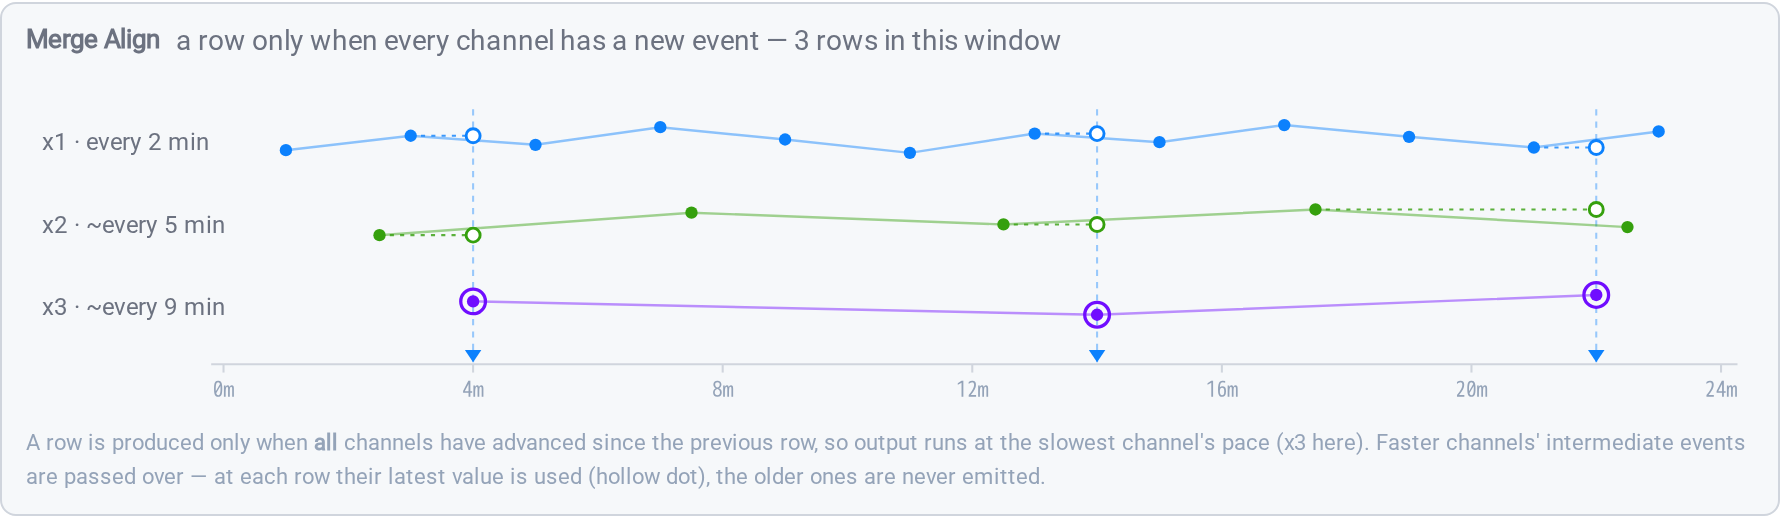
A row is produced only when all channels have advanced since the last row. The
output therefore runs at the pace of the slowest channel.
Use it when a row is only meaningful if every input is genuinely new: comparing
two instruments where a repeated value would be a false reading.
The cost is discarded data. The faster channels' intermediate events are never
emitted; at each row only their latest value is used. If x1 reports twelve times
and x3 three times, you get three rows and nine of x1's readings are passed over.
Interval: a fixed grid
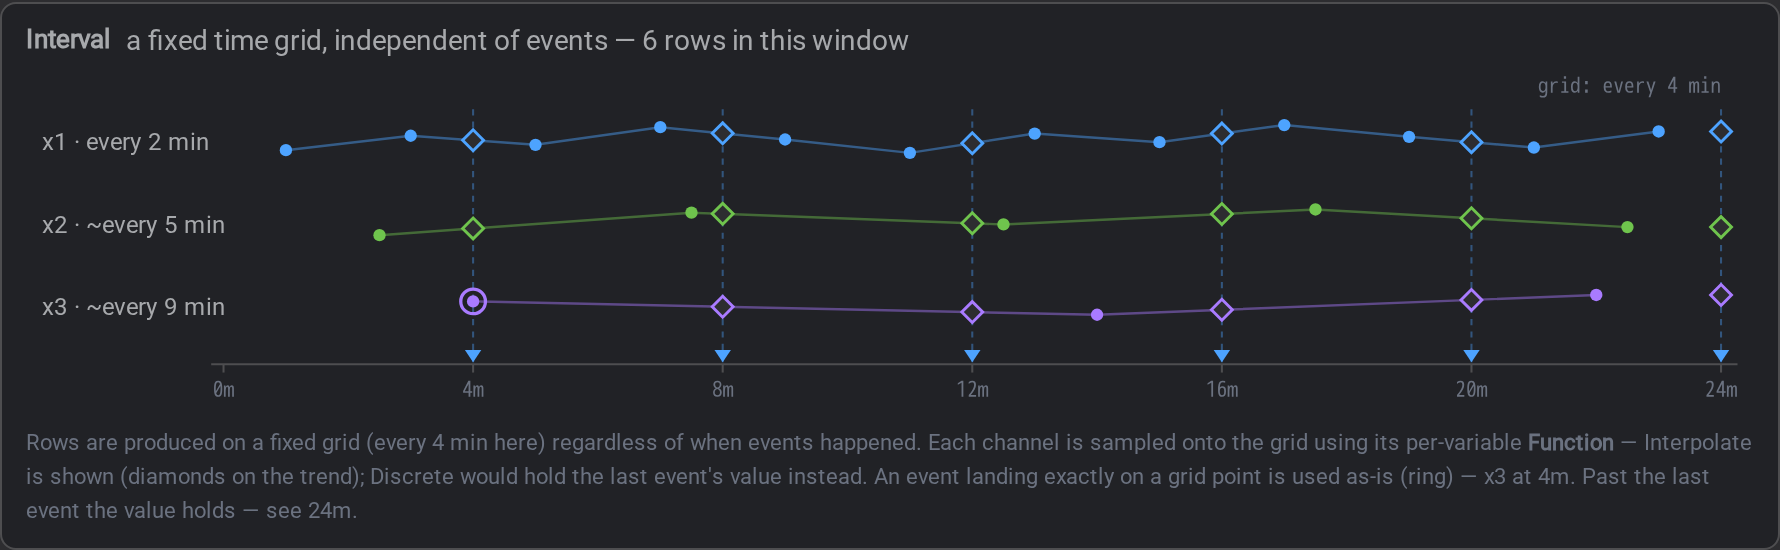
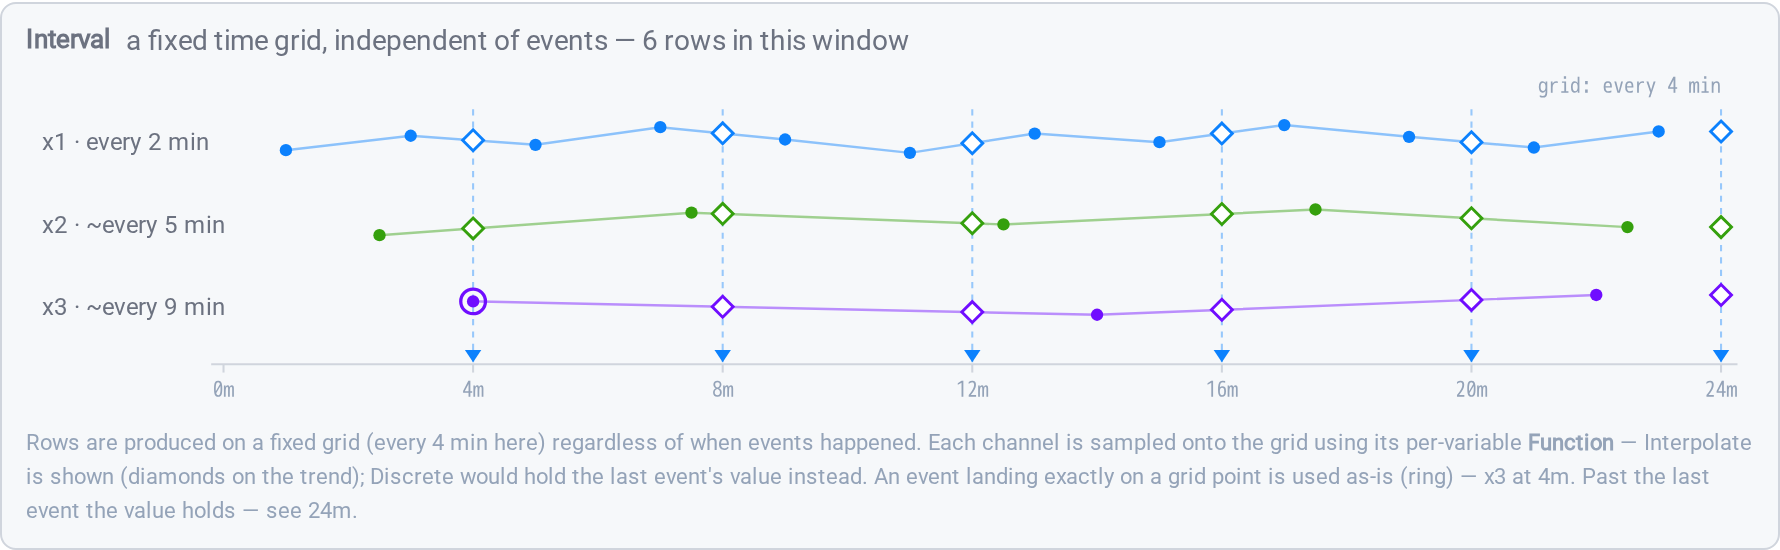
Rows appear on a fixed cadence, every 4 minutes in the figure, regardless of when
events happened. Each channel is placed onto the grid using its own Function,
which this mode adds as a column on the variable grid:
| Function | On a grid point, the value is… |
|---|---|
| Interpolated | computed between the surrounding events (the diamonds) |
| Discrete | the last event's value, held |
An event landing exactly on a grid point is used as-is. Past the last event the value
holds rather than extrapolating.
Use it whenever the output feeds analysis, a chart, or a SQL table someone will
aggregate. A regular grid is what almost every downstream tool expects. It also
makes row counts predictable: an hour at one-minute spacing is sixty rows per asset,
whatever the instruments did.
Interval and Keys accept only two functions
Every other mode reads with a function fixed by the mode itself. Interval and Keys are
the two that honour a per-variable override, and the two they honour are
Interpolated and Discrete.
On a task with a calculation, anything else fails the run rather than being
ignored. A channels-only table or JSON task is not validated the same way: an undeclared
function is filled in as Interpolated, and anything declared is kept as declared. Either
way, these two are the ones that behave as described.
Keys: one channel sets the timeline
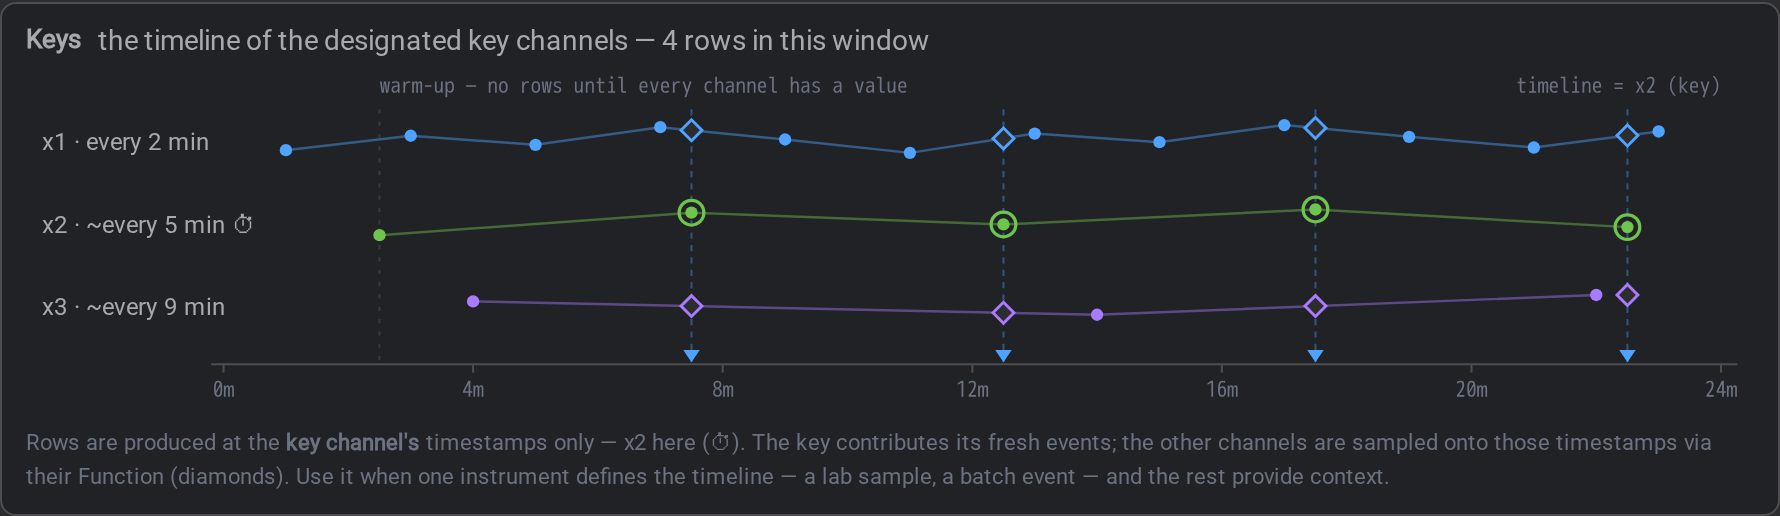
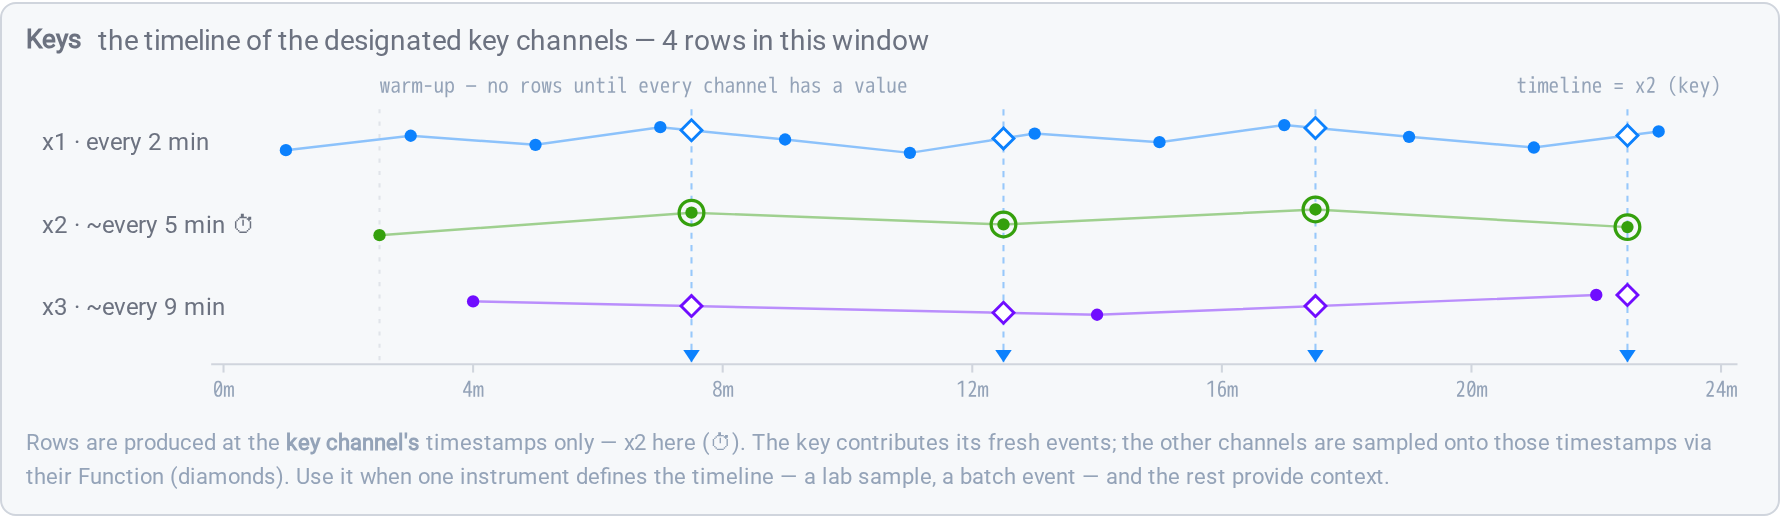
Rows appear at the timestamps of the channel, or channels, you nominate as the key.
Everything else is sampled onto those timestamps through its Function.
Use it when one instrument defines the event and the rest are context. A lab
sample, a batch completion, a quality check: the question is "what was everything else
doing at that moment", and that is exactly what this produces.
You must nominate at least one key channel. A key-aligned task with no key declared
will not run: there is nothing to align to.
Snapshot: one row per run
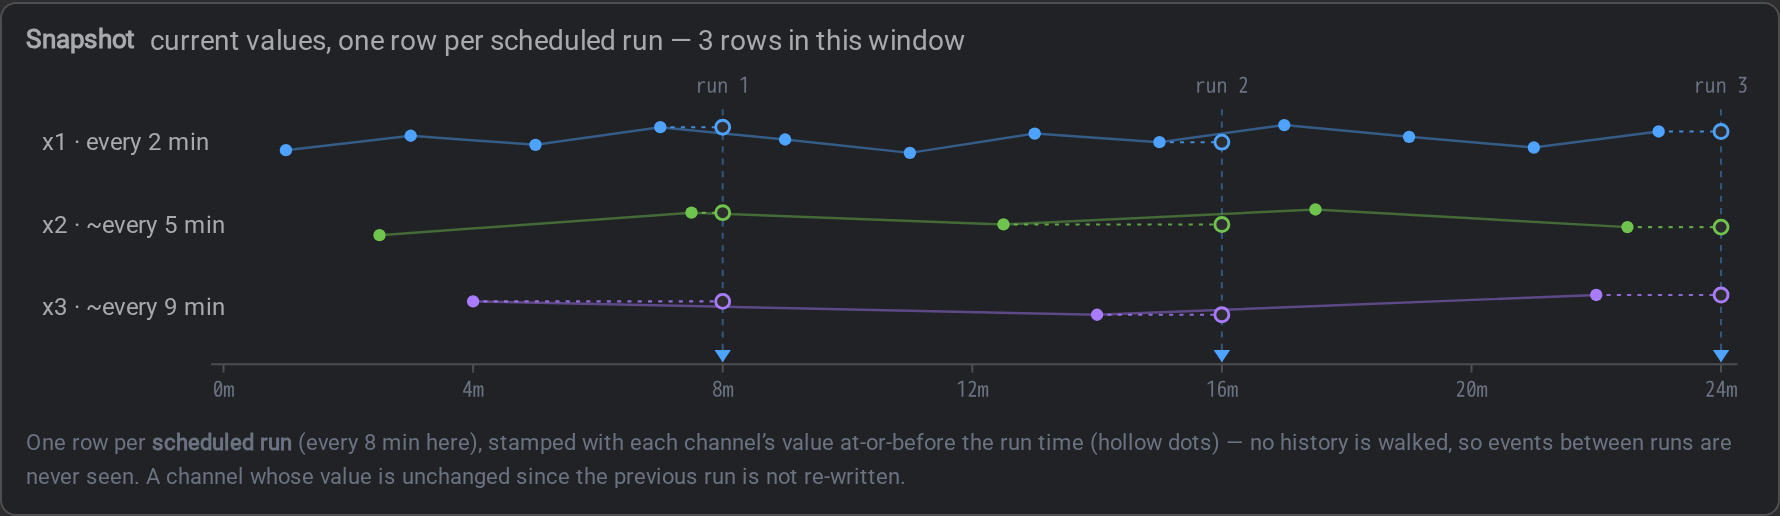
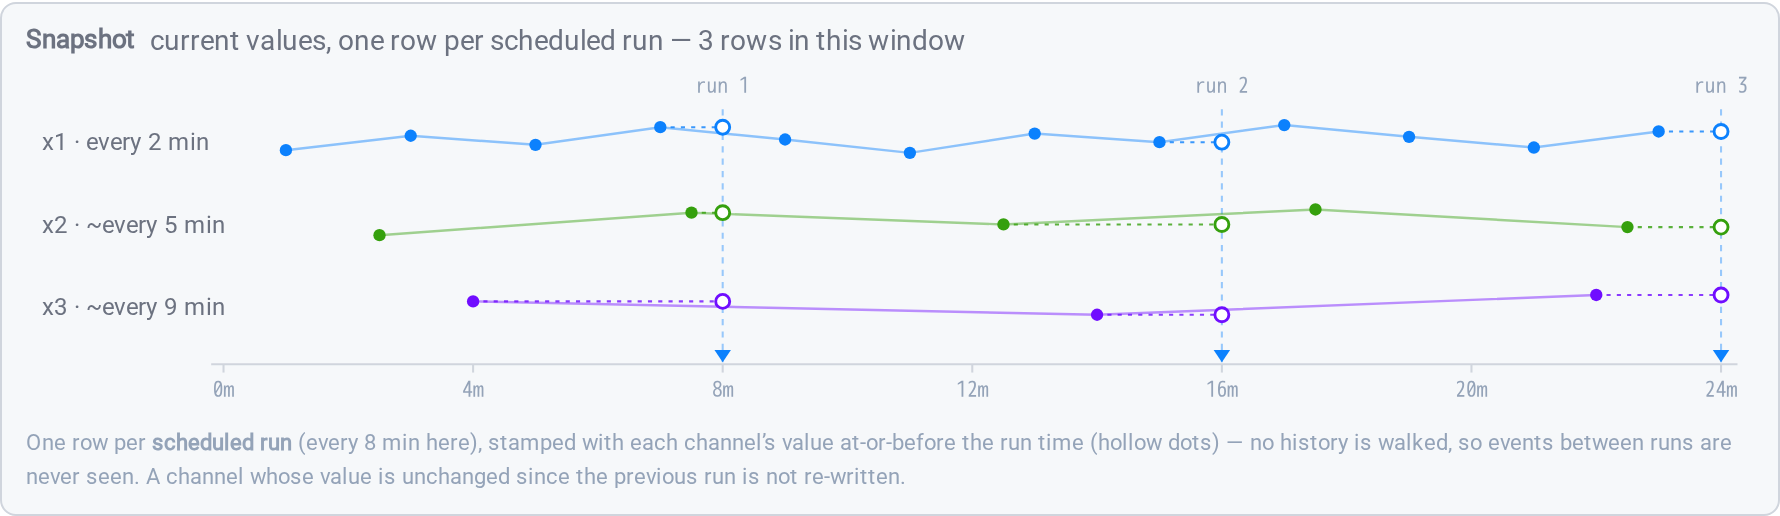
One row each time the task's schedule fires, stamped with each channel's value
at-or-before that moment. No history is walked, so events between runs are never
seen.
Use it for current-state output: a dashboard table, a "latest values" export.
Do not use it for analysis. A task running every eight minutes against sensors
reporting every two will silently skip three readings in four. That is the intended
behaviour, not a fault, but it is the wrong tool for a trend or an average.
A channel whose newest reading is no newer than the one already written is not
written again. The test is the timestamp, not the value, so a flat sensor still
produces a row on every run as long as it keeps reporting, and a changed value arriving
under an unchanged timestamp does not.
The offsets
The mode decides the rows. The offsets decide which slice of time the task reads, and
which part of the result it is willing to write: a grace period for late data, history
read as context, and results withheld until their window closes.
They have a page of their own: The offsets.
How a run is paged
A long window is not read in one go. Page size is a performance setting and cannot
change a value, but page boundaries are worth understanding for a windowed calculation.
See How a run is paged.
What each setting actually affects
The single table worth coming back to, spanning this page, the
offsets and paging. "Read" is which data the task
fetches; "Emitted" is what ends up written.
| Setting | Affects what is read | Affects what is emitted |
|---|---|---|
| Mode | Yes, which timestamps | Yes, which rows exist at all |
| Interval | Yes | Yes: the grid, in Interval mode |
| Key channels | Yes | Yes: the timeline, in Keys mode |
| Realtime offset | Yes: the window ends earlier | Indirectly: less data, so fewer rows. Adds lag. |
| Start offset | Yes: the window starts earlier | No. Output below the watermark is discarded; the extra data is context only. No lag. |
| Output hold-back | No | Yes: the trailing region is withheld. Adds lag. |
| Page read event count | Yes, per call | No, performance only; it cannot change a value. |
| Page write event count | No | No: batching only |
| Request event count | Yes: chunking | No |
The row to notice is output hold-back: it is the only setting that changes what is
written without changing what is read.
Working out which mode you need
| If you want… | Use |
|---|---|
| Every reading preserved, nothing lost | Merge Union |
| Rows only where all inputs are genuinely new | Merge Align |
| A regular grid for analysis or a chart | Interval |
| Rows at a lab result or batch event | Keys |
| Current values, one row per run | Snapshot |
If you are unsure, Interval is the safest choice for anything feeding analysis, and
Merge Union for anything meant as a faithful record.
Whatever you pick, open the Preview tab afterwards. The mode
changes the row count dramatically: the same three channels give 17 rows under Merge
Union and 3 under Merge Align, and the preview is where that becomes obvious rather
than surprising.
What's Next
With the rows decided, define what each one contains. Continue to
Task Calculation →.
Related
- Tasks: the tabs this one sits among
- Task Calculation: the calculation these rows feed
- Task Scheduler: the run cadence Snapshot mode keys off