
Exploring Data on a View
Exploring Data on a View
From any display, you can interact with live and near real-time data directly: adjust the time range, read exact values from any point, and open an ad hoc trend to investigate further.
Time Control
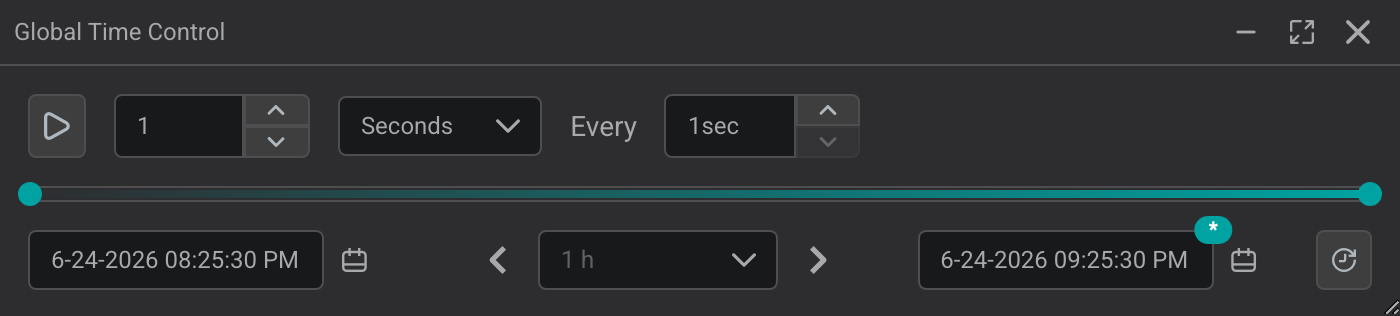
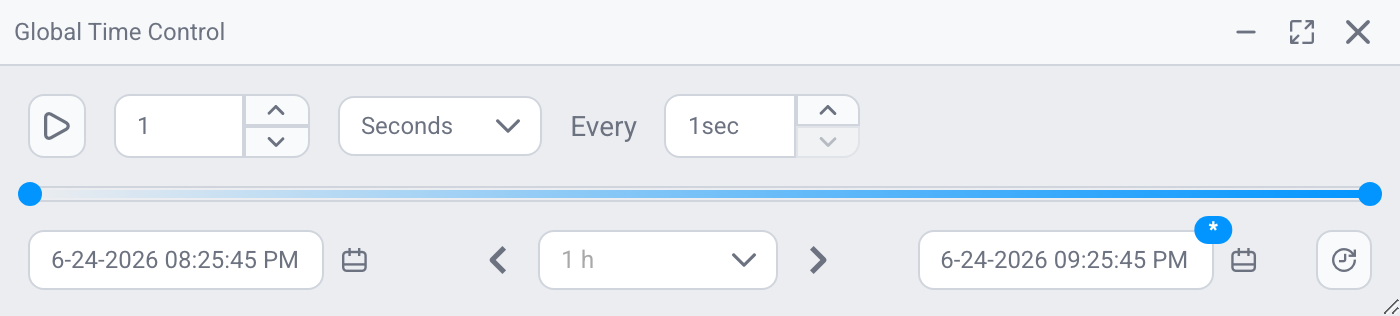
When a display opens, IOTA loads it at its configured time context. Use the time control in the top bar to adjust the displayed timeframe. The time selection affects all data shown on the current view unless individual components are configured to ignore it.
Components that display a single value will always use the end time (at or before) to show the value, provided it falls within the time range of the display.
Open the time control from the top menu bar: it is the first item (see Additional Top Menu Bar Items):


- Use time pickers for start and end time, or the duration selector
- Use the back and forward buttons (
<>) to quickly step one duration back or forward - The real-time indicator shows whether the display is requesting real-time updates. By default IOTA requests updates every 1 second, but the actual update frequency depends on the data source
Using Tooltips to See More Data
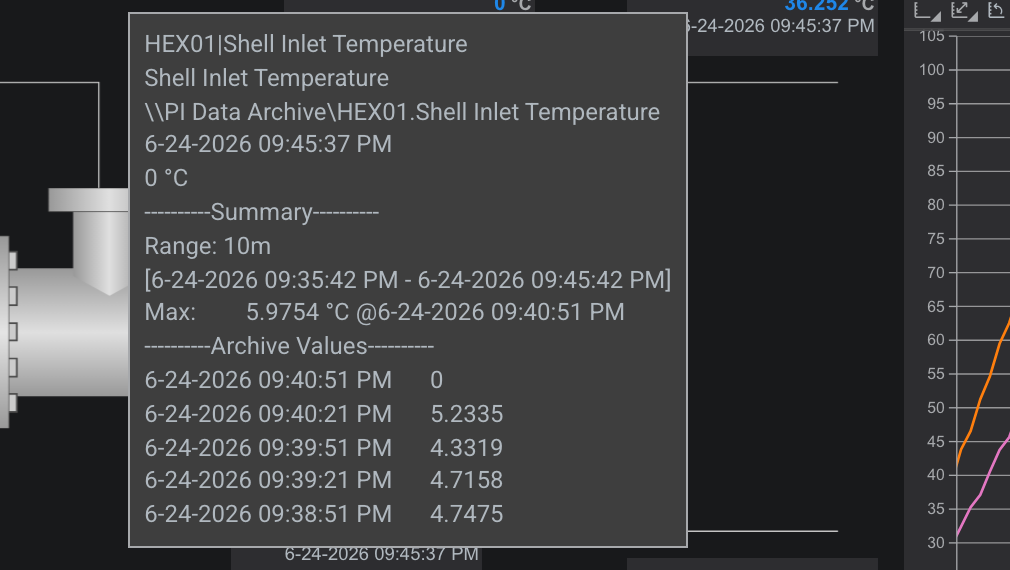
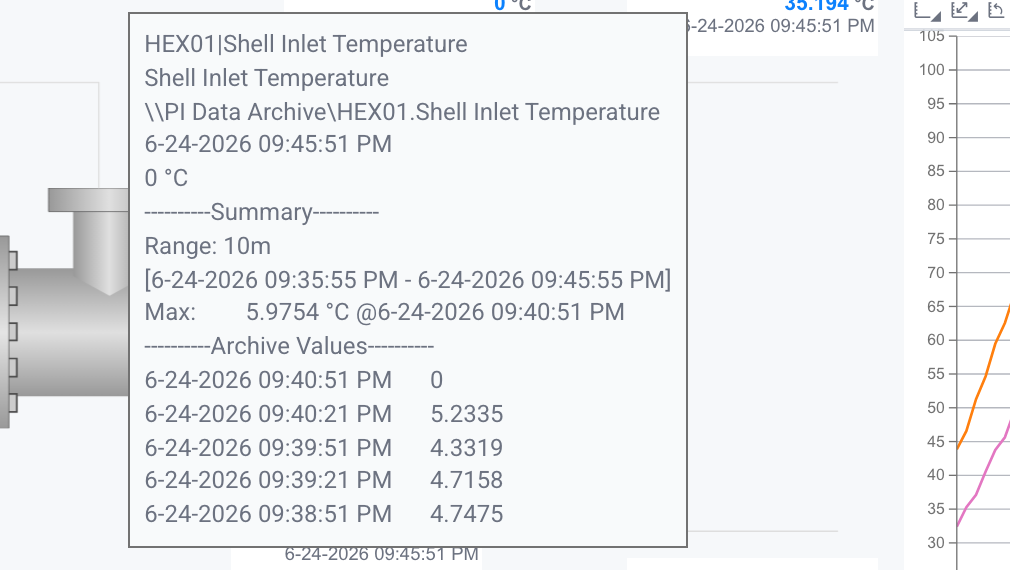
Hover over a component to see details about the signal behind it. The tooltip shows the item name and description, its data reference (the source path, for example, a PI AF attribute path, when the data source provides one), the timestamp, and the current value.
If the display's builder has enabled the advanced tooltip, it also shows summary statistics (such as the minimum and maximum over a time range) and recent archive values.
Ad Hoc Trend
The ad hoc trend tool lets you quickly visualize data without building a dedicated display. You can open it in several ways:
- From a display: double-click or right-click a signal on any view
- From search: select tags or asset attributed in the search results and open them in the trend
You can open an Adhoc Trend from a view using one of the following methods:
- Double-click a component
- Right-click the component →
Show Trend - Cmd/Ctrl + click to select multiple components, then right-click →
Show Trend
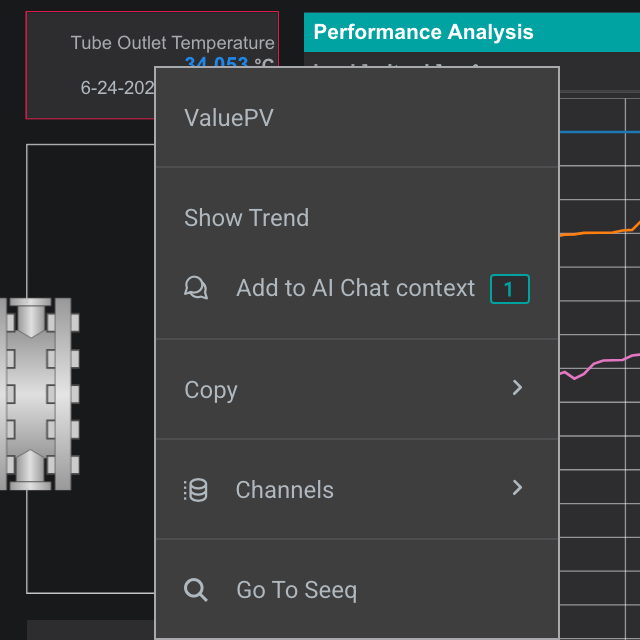
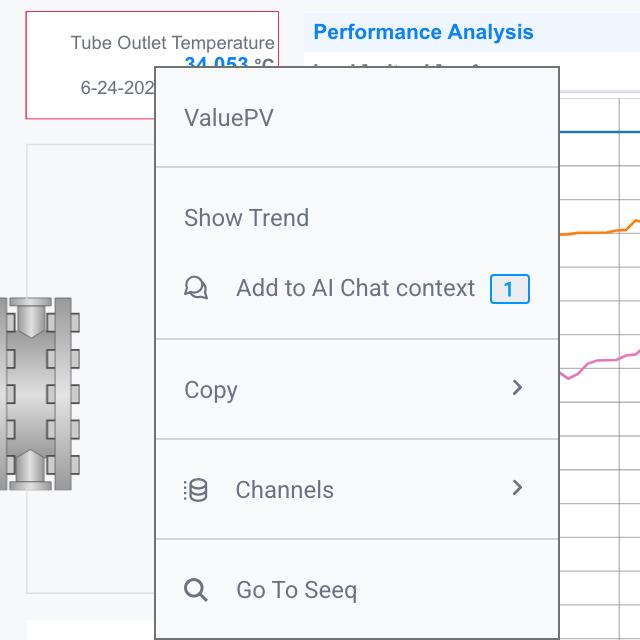
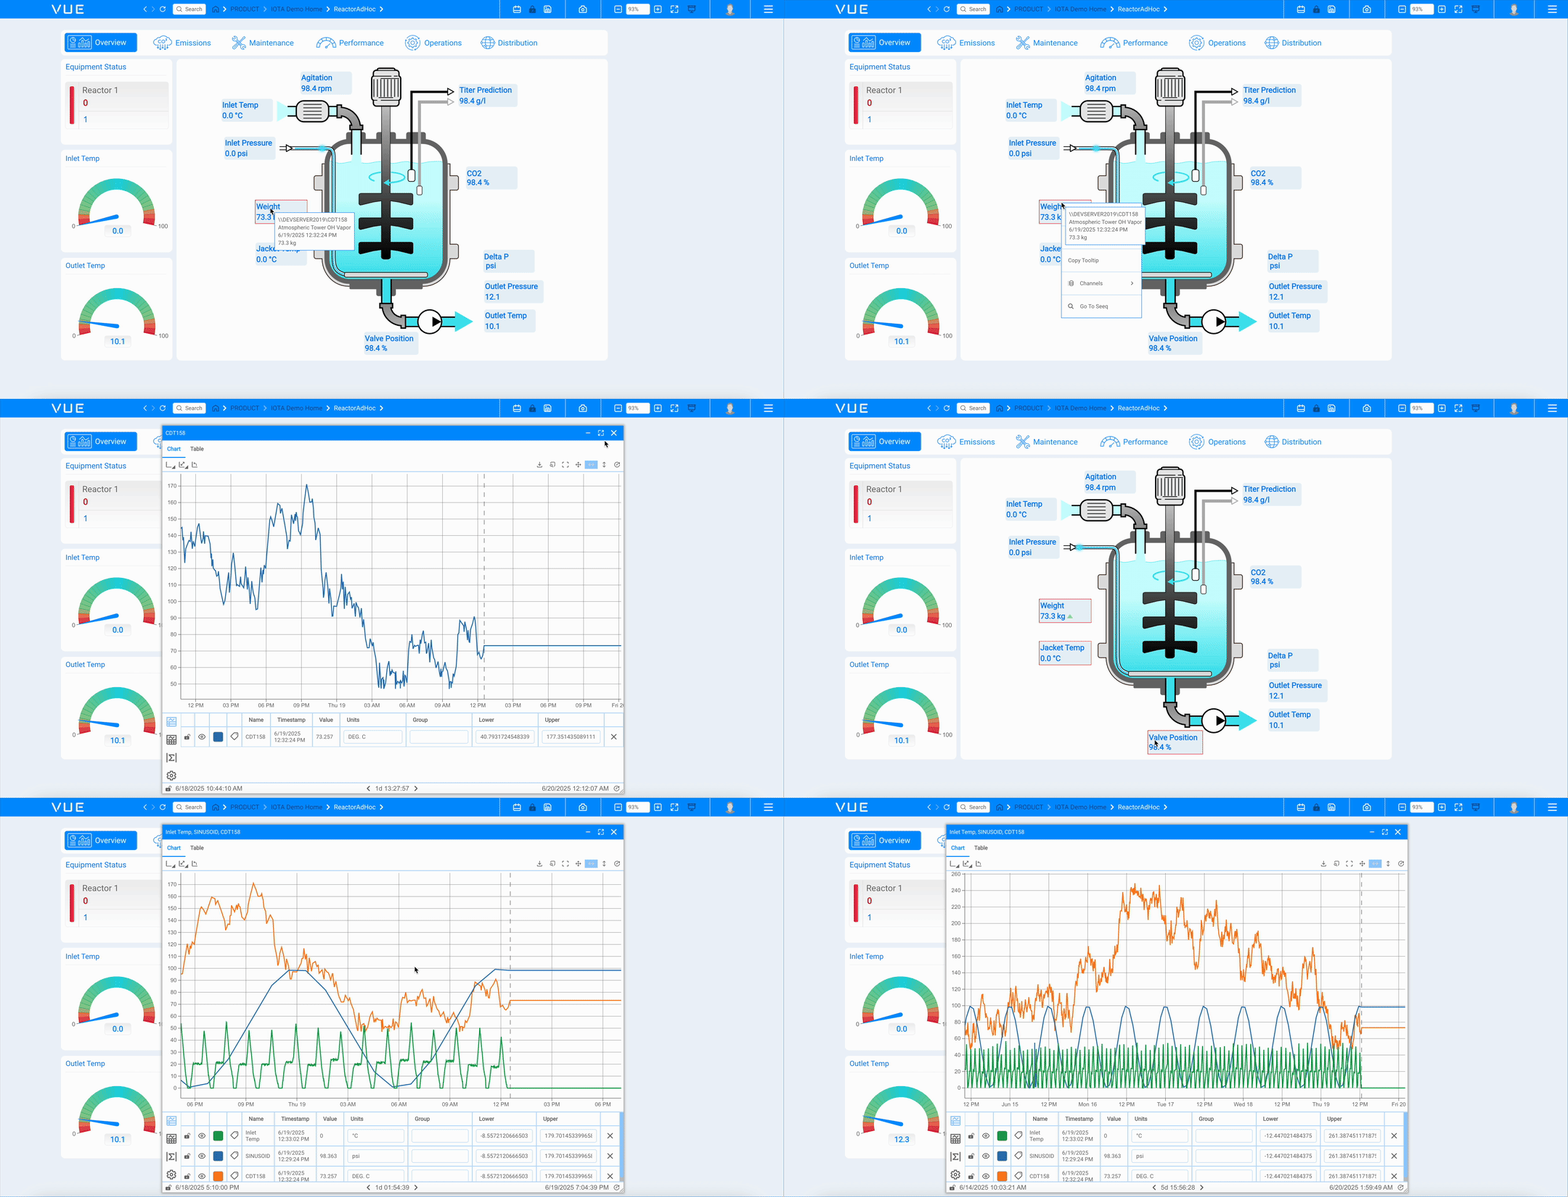
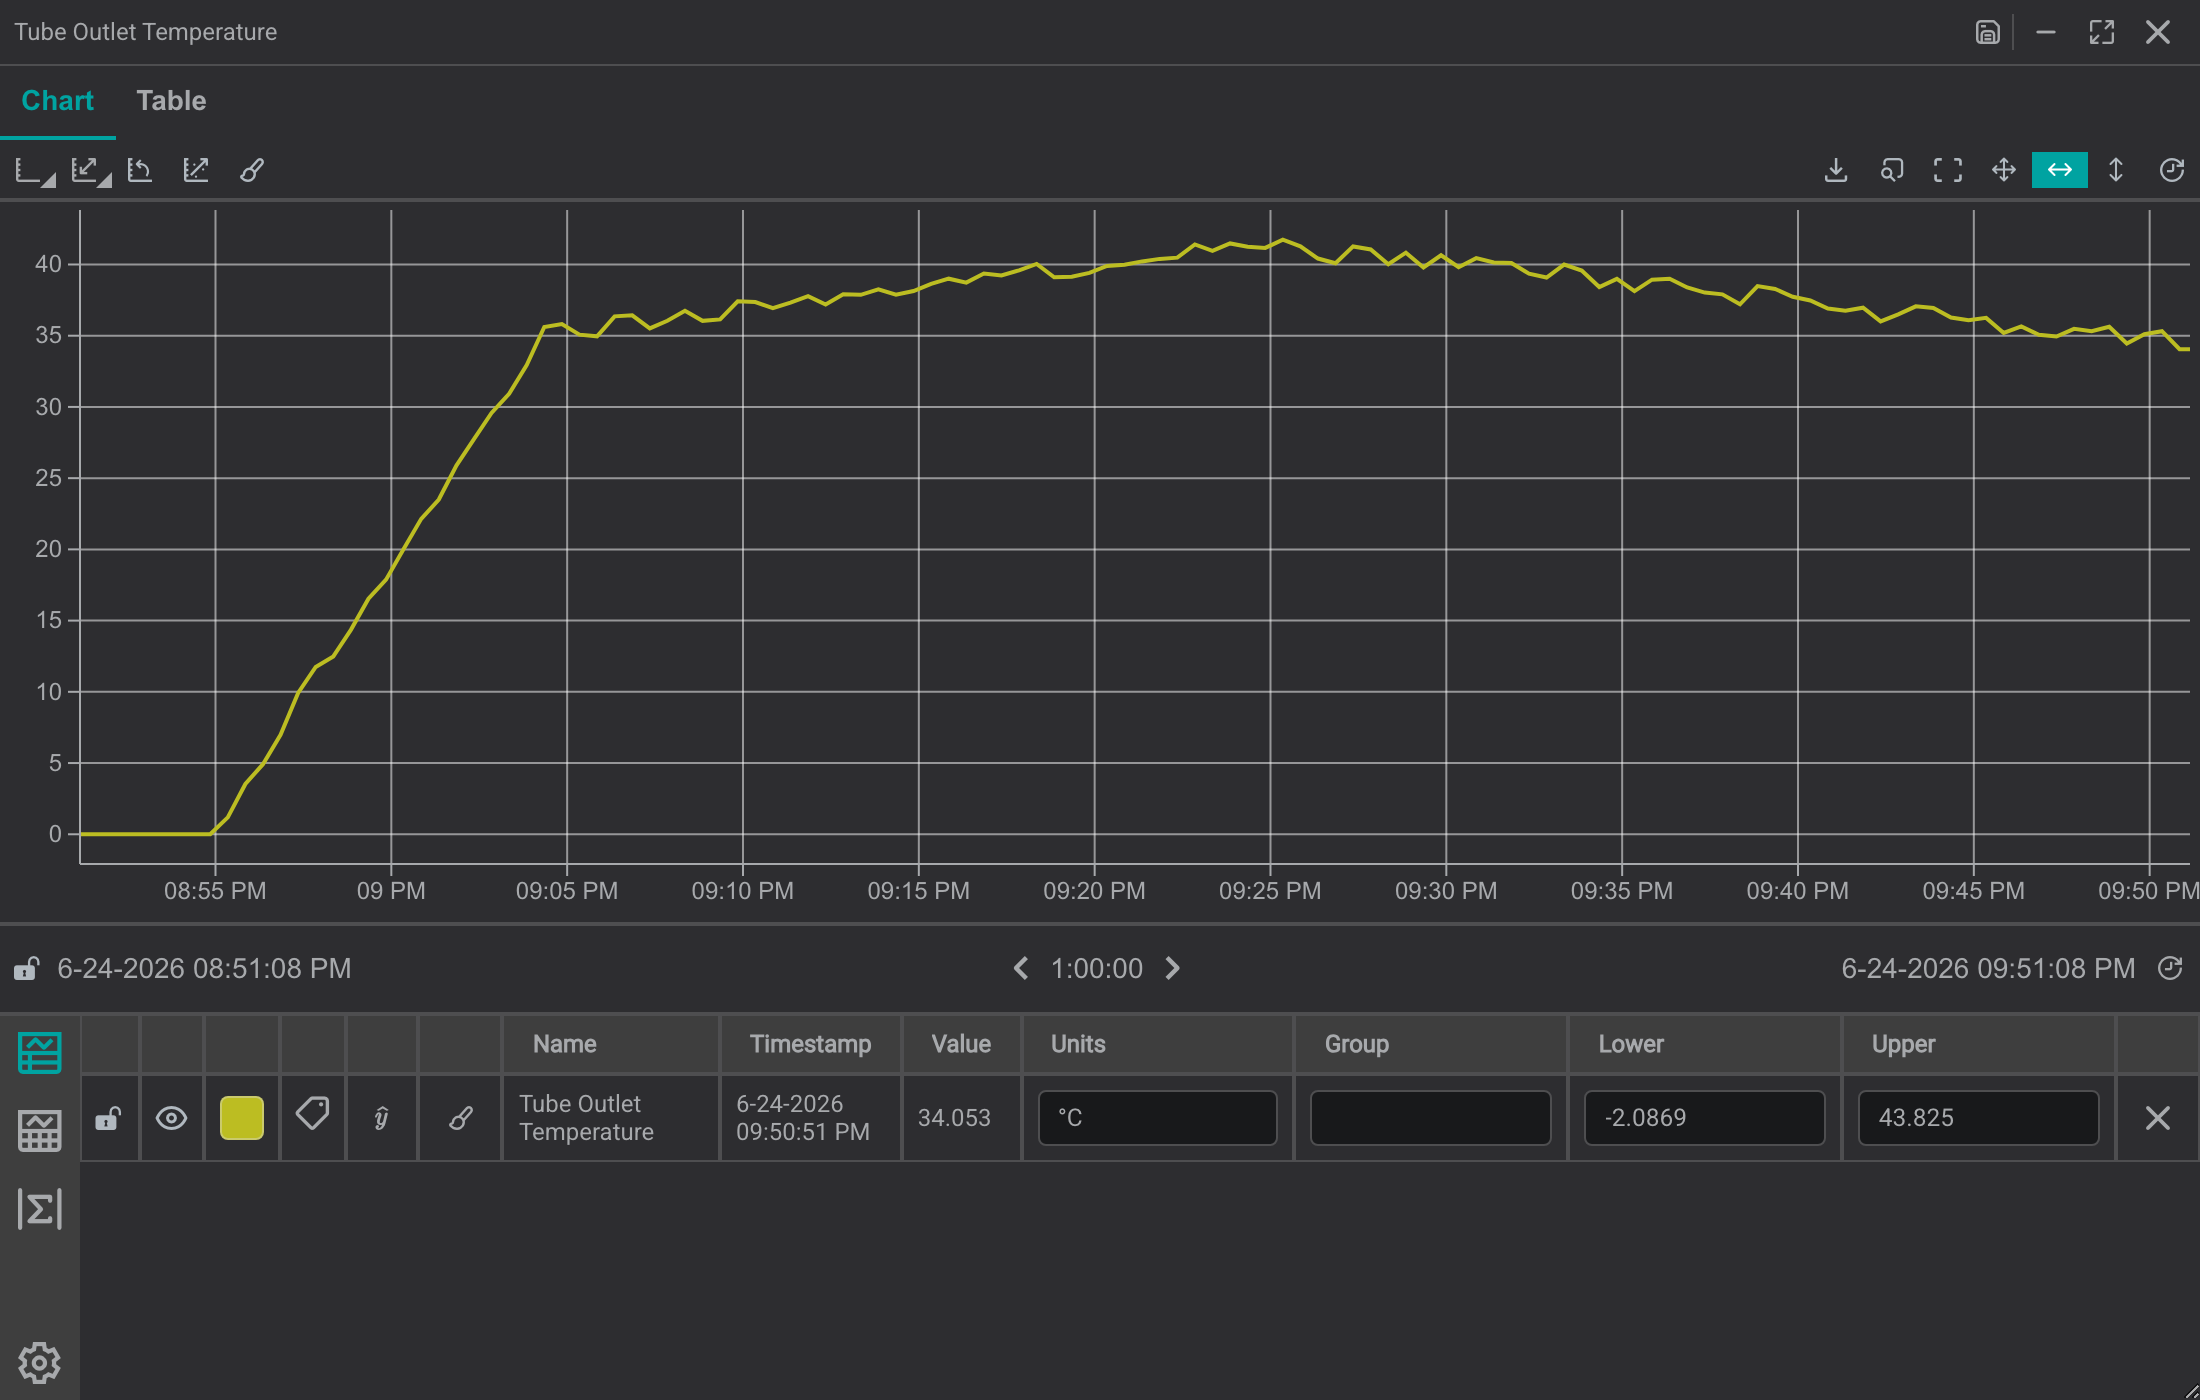
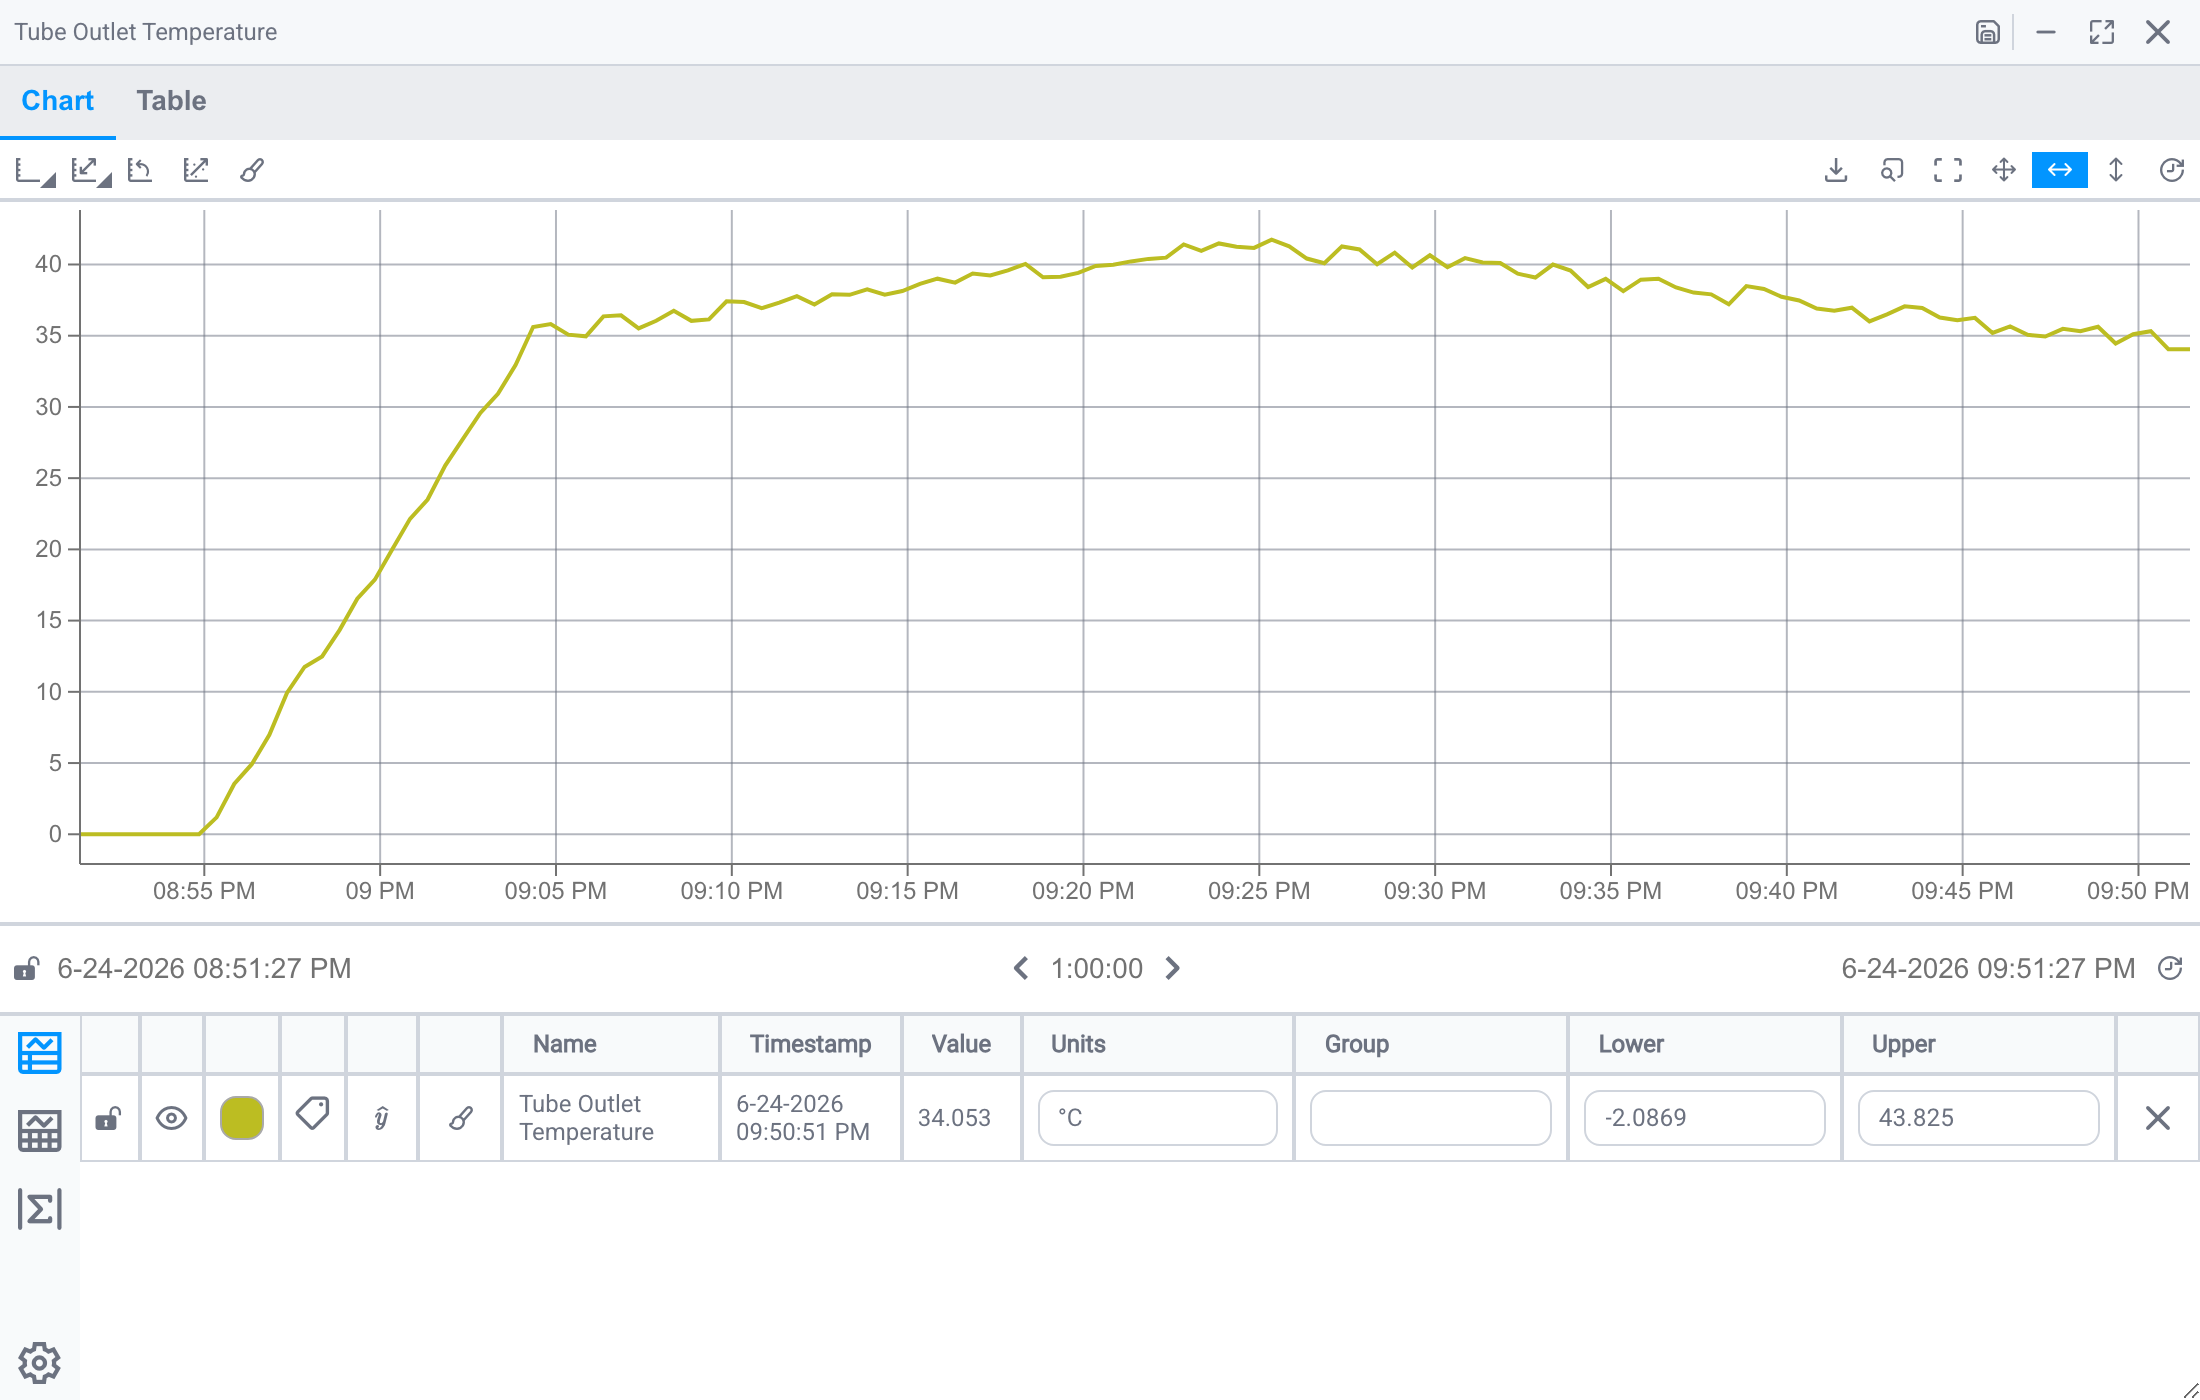
The trend opens in a floating window with a chart, time control, and a legend table. From here you can add more signals, change the time range, or switch to the table view:
Tips
An ad hoc trend's layout depends on its component style. These examples use a style that shows a table legend below the chart. Your administrator sets the default layout, and you can choose your own under Default Component Style in your user profile, so the same trend can look different from one person to the next.
Tips
By default an ad hoc trend opens as a floating window on top of the display. To open it in a separate browser window instead, turn on Open Adhoc in New Window in your user profile.
IOTA supports launching multiple ad hoc trend windows. You can keep adding items to an existing ad hoc trend or launch a new one.
You can use the following trend controls:
- Resize via bottom-right corner
- Maximize using the expand icon in the top-right corner
- Collapse using the
_icon in the top-right corner - Close using the
×icon in the top-right corner
Collapsing is especially useful when you want to do ad hoc trending across multiple displays. When collapsed, the Adhoc Trend appears as a small tab in the top-right corner of the view.
Click the expand icon on the tab to reopen it: your selected channels and settings are preserved.
What's Next
When a display doesn't show quite what you need, continue to Trending Data to build an ad hoc trend: a chart you assemble on the fly to investigate any signals over time.
Related
- Trending Data: build ad hoc trends
- Viewer Workspace: move between views and control the time range
- Troubleshooting & Notifications: when data looks wrong