
Trending Data
About 1 min
Trending Data
Most data investigation in IOTA Vue happens in an ad hoc trend: a chart you build on the fly to look at one or more signals over time. Unlike a display someone designed in advance, an ad hoc trend is yours to assemble in the moment: add the signals you care about, set the time range, then compare, zoom, and annotate until you understand what happened.
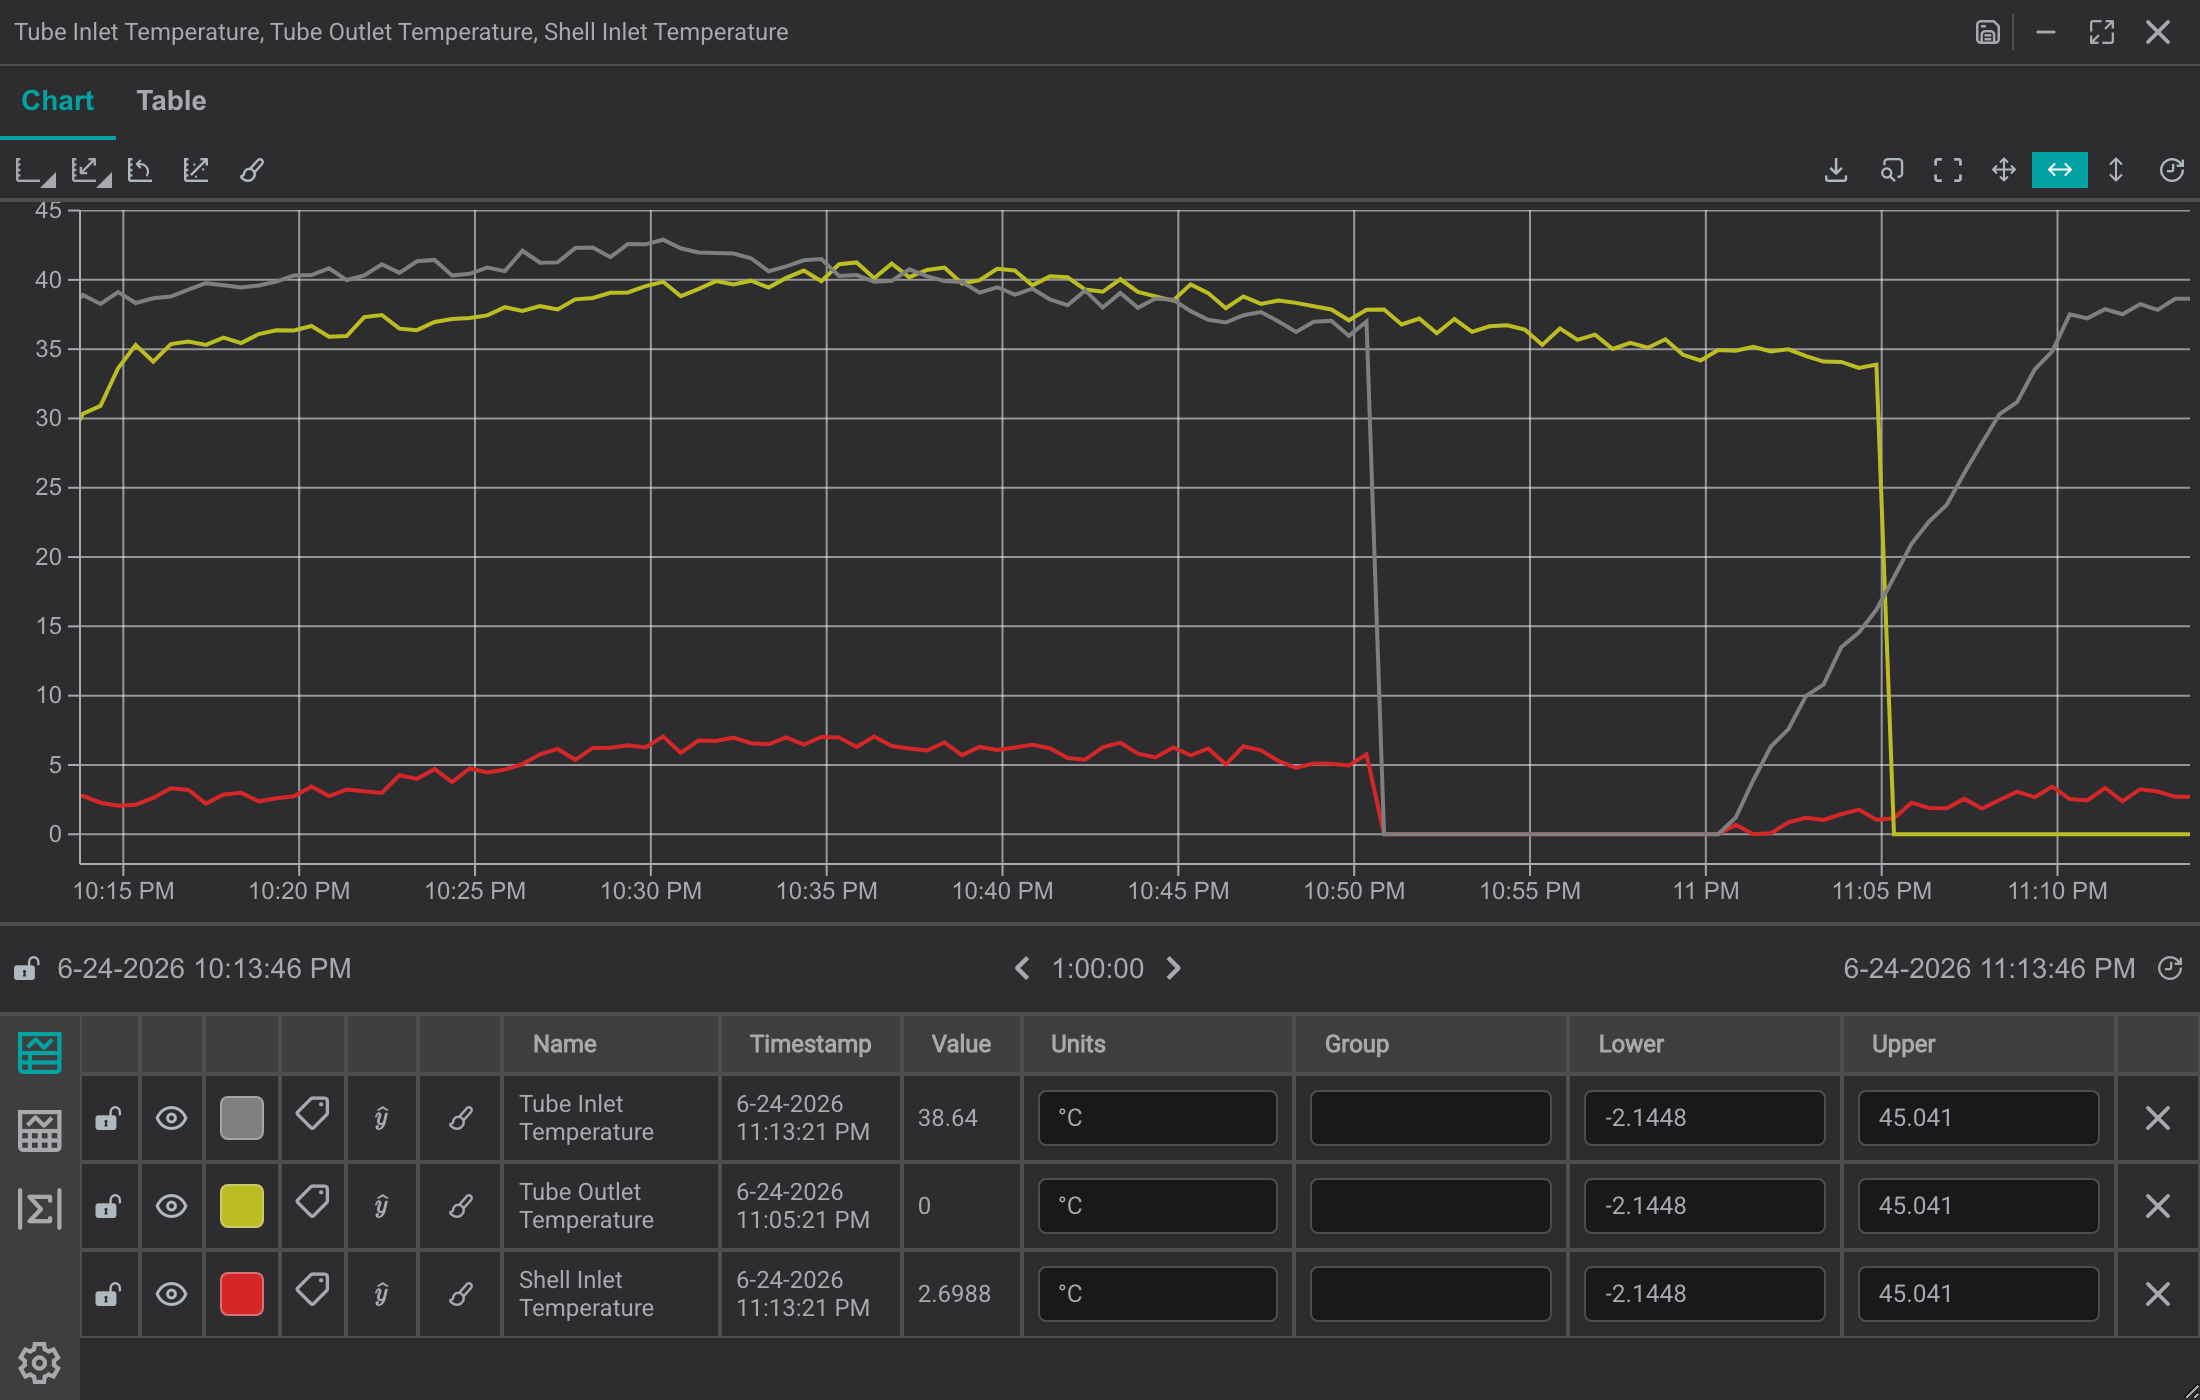
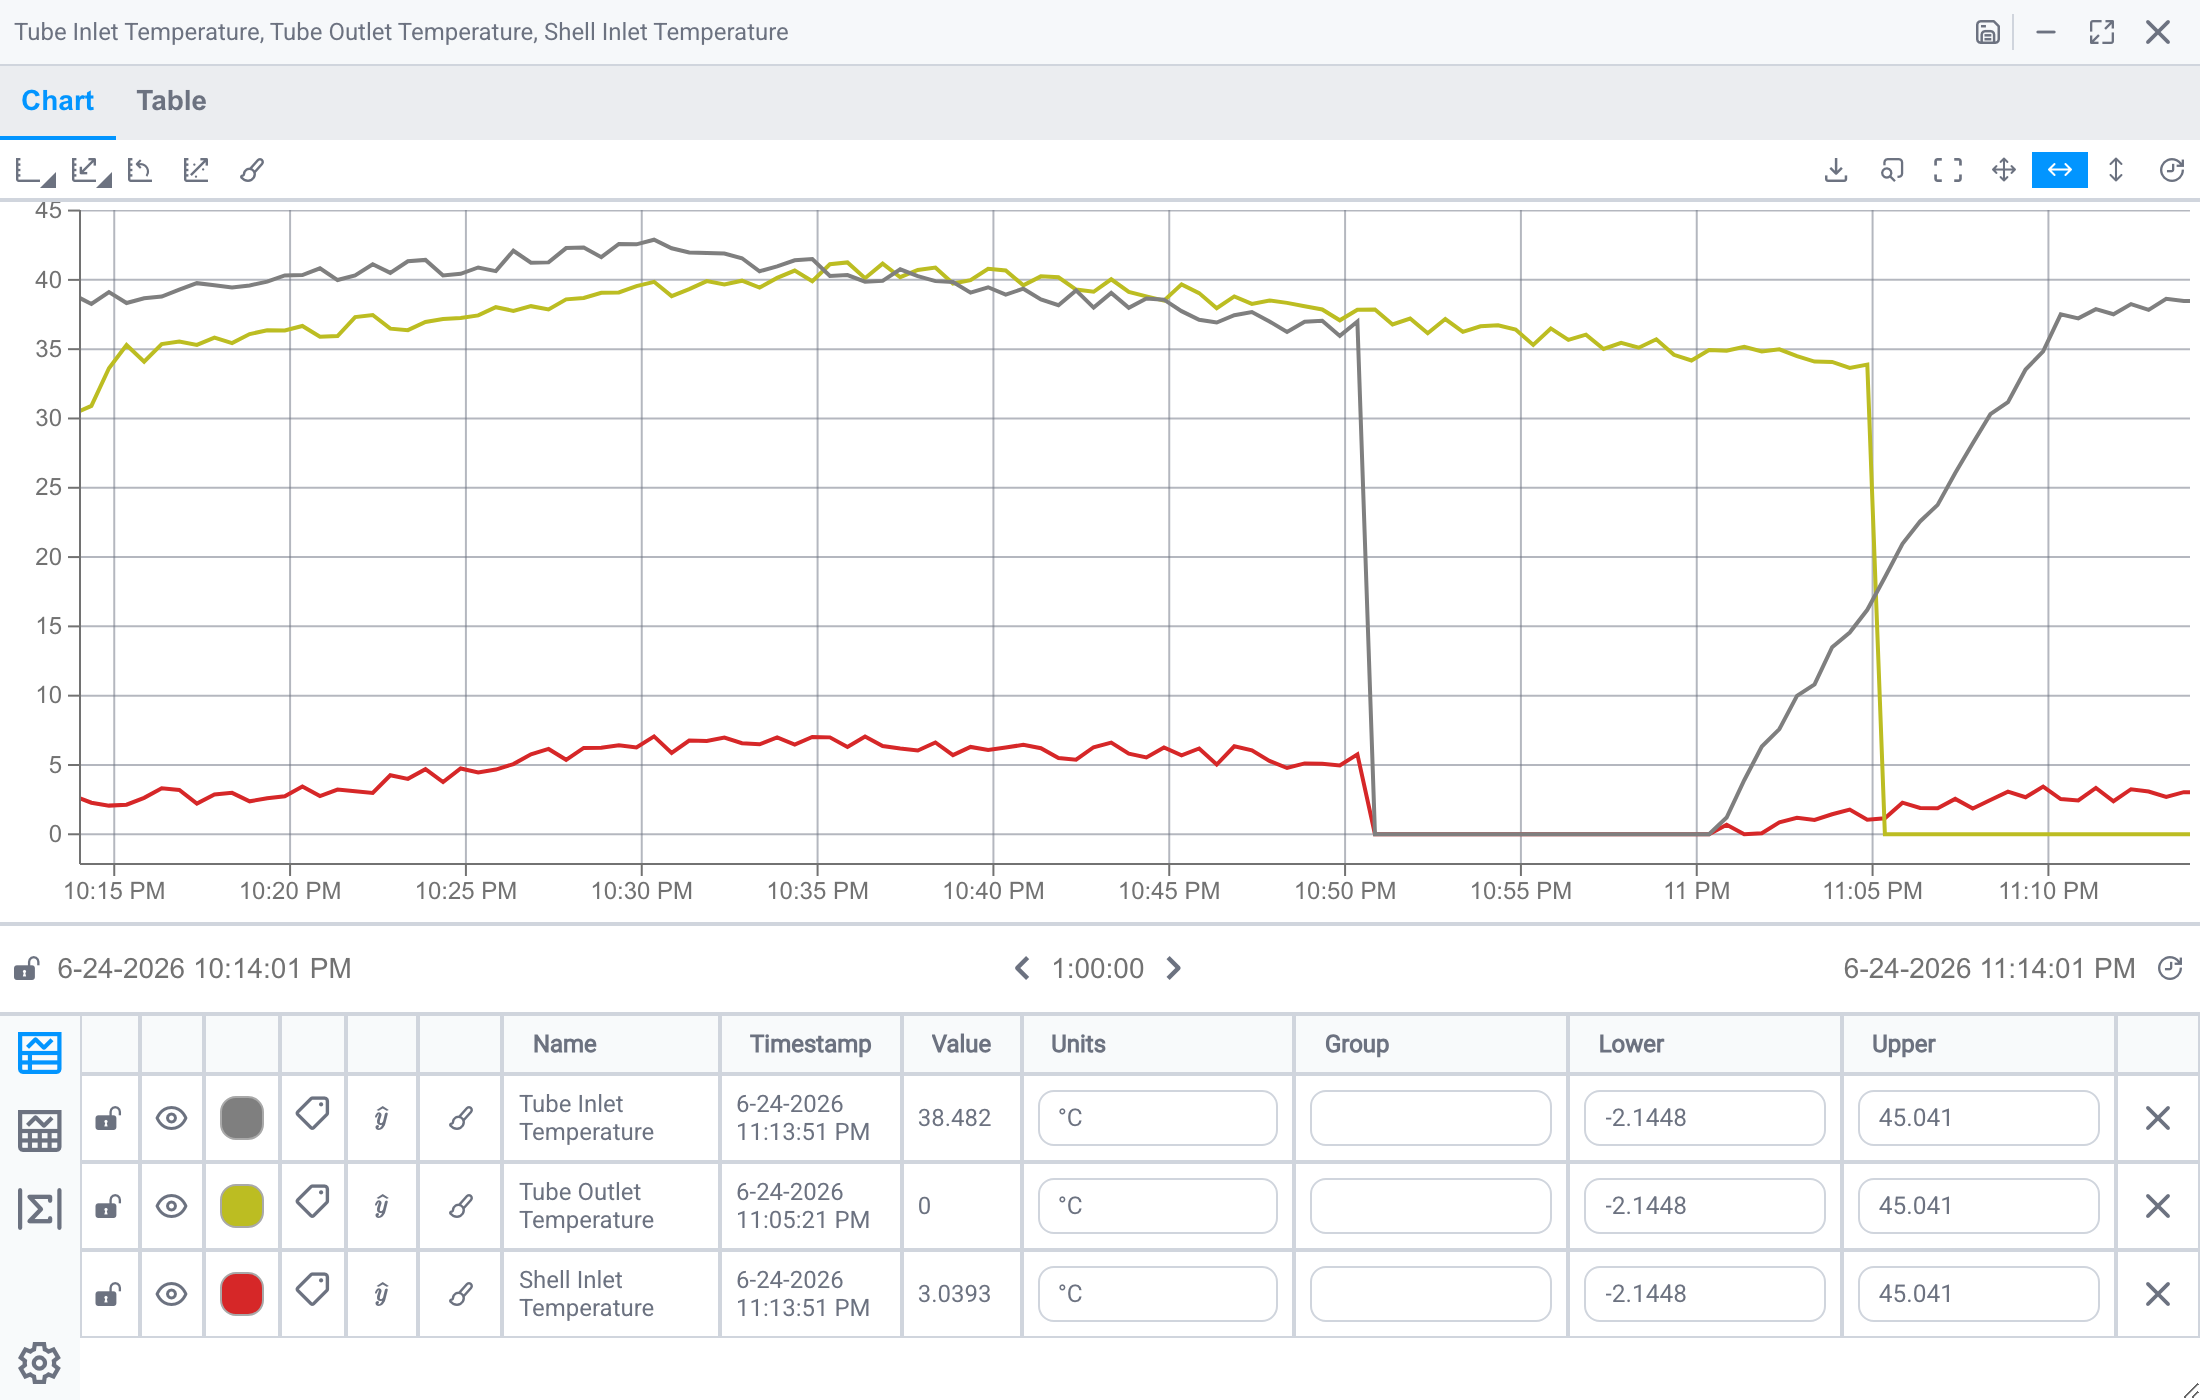
You can start an ad hoc trend two ways:
- From the screen: right-click a component on any display and choose Show Trend. This is the fastest way to dig into something you can already see.
- From search: open the Search tab in the side panel, find the tags or assets you want, and trend them directly. This is useful when the signal you need is not on the current display.
See Finding Data to Trend for both approaches in detail.
In this section
- Finding Data to Trend: locate signals to trend, from the screen or from search, and understand the data types you can search for.
- Building a Trend: get signals into a trend (from the screen or search) and set the time range.
- Customizing a Trend: adjust trace color, plot type, and scales, and visualize state signals as timebars.
- Analyzing a Trend: read exact values with cursors, zoom into events, highlight out-of-spec areas, and add regression and limit lines.
- Saving Ad Hoc Trends: save a trend so you can return to it later.
- Sharing Ad Hoc Trends: share a saved trend with colleagues or send a link.
- Data Export: export trend or component data to CSV.
What's Next
Start building a trend by locating your signals: continue to Finding Data to Trend.
Related
- Finding Data to Trend: locate signals to trend
- Building a Trend: add signals and set the time range
- Exploring Data on a View: open a trend from any display