
Building a Trend
Building a Trend
An ad hoc trend starts with the signals you want and the time range to view them in. This page covers getting signals into a trend and setting its time window. Once it's built, see Customizing a Trend and Analyzing a Trend.
The Trend Window
An ad hoc trend opens as a floating window on top of the display you're viewing, so you keep your place. The window stays open as you navigate between views, handy for comparing data across displays, and you can have several trends open at once, each in its own window.
Manage the window from the controls in its top-right corner:
- Resize: drag the bottom-right corner.
- Maximize: the expand icon fills the view; click again to restore.
- Minimize: the
_icon collapses the trend to a small tab in the top-right corner. Click the tab to reopen it with your signals and settings intact. - Close: the
×icon discards the trend.
Ad hoc trends are temporary: they close when you refresh the browser. To keep one for later, see Saving Ad Hoc Trends. To open each trend in a separate browser window instead of a floating popup, turn on Open Adhoc in New Window in your user profile.
The Trend's Table Legend
Many trending tasks are driven from the trend's table legend: the panel below the chart that lists each signal and its settings. Not every component style shows a table legend; if yours doesn't, adjust the trend component's style to include one (see Exploring Data).
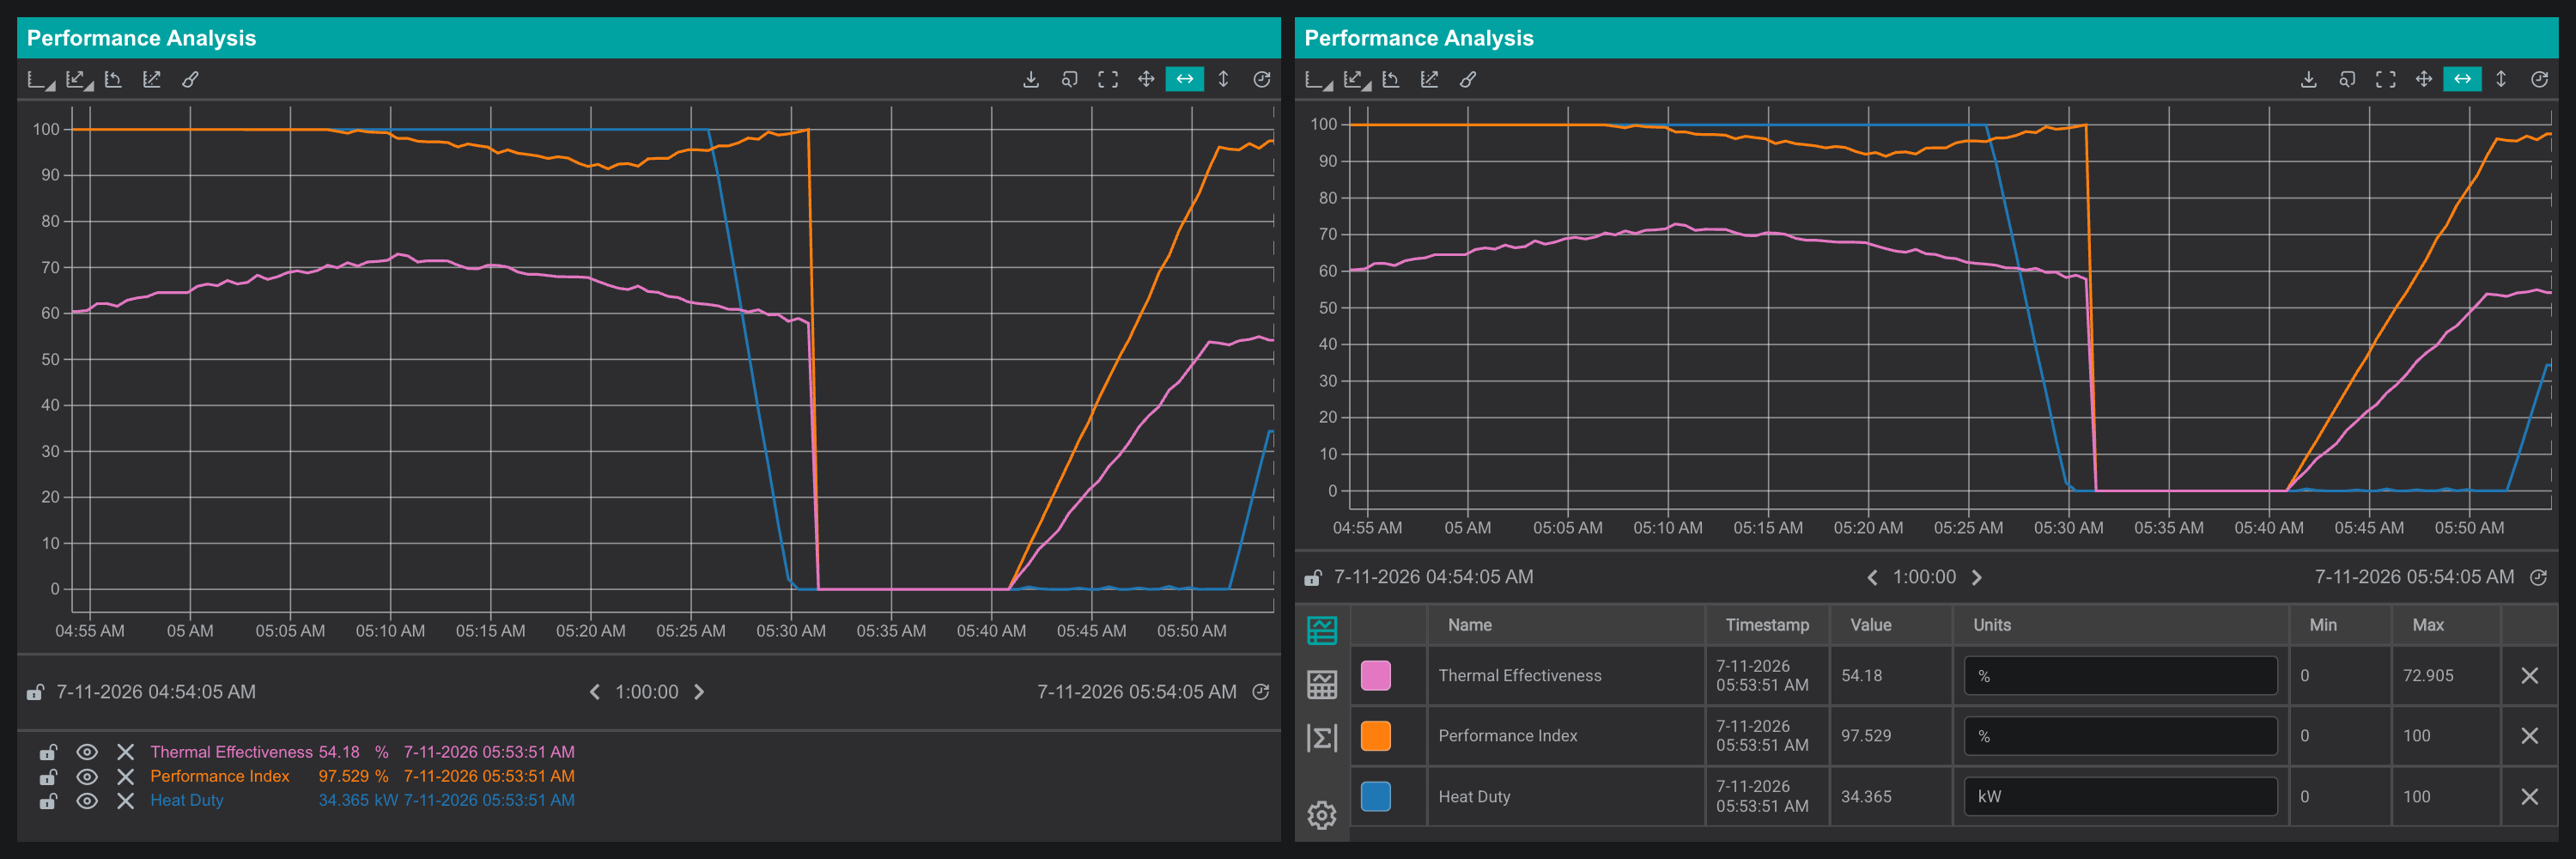
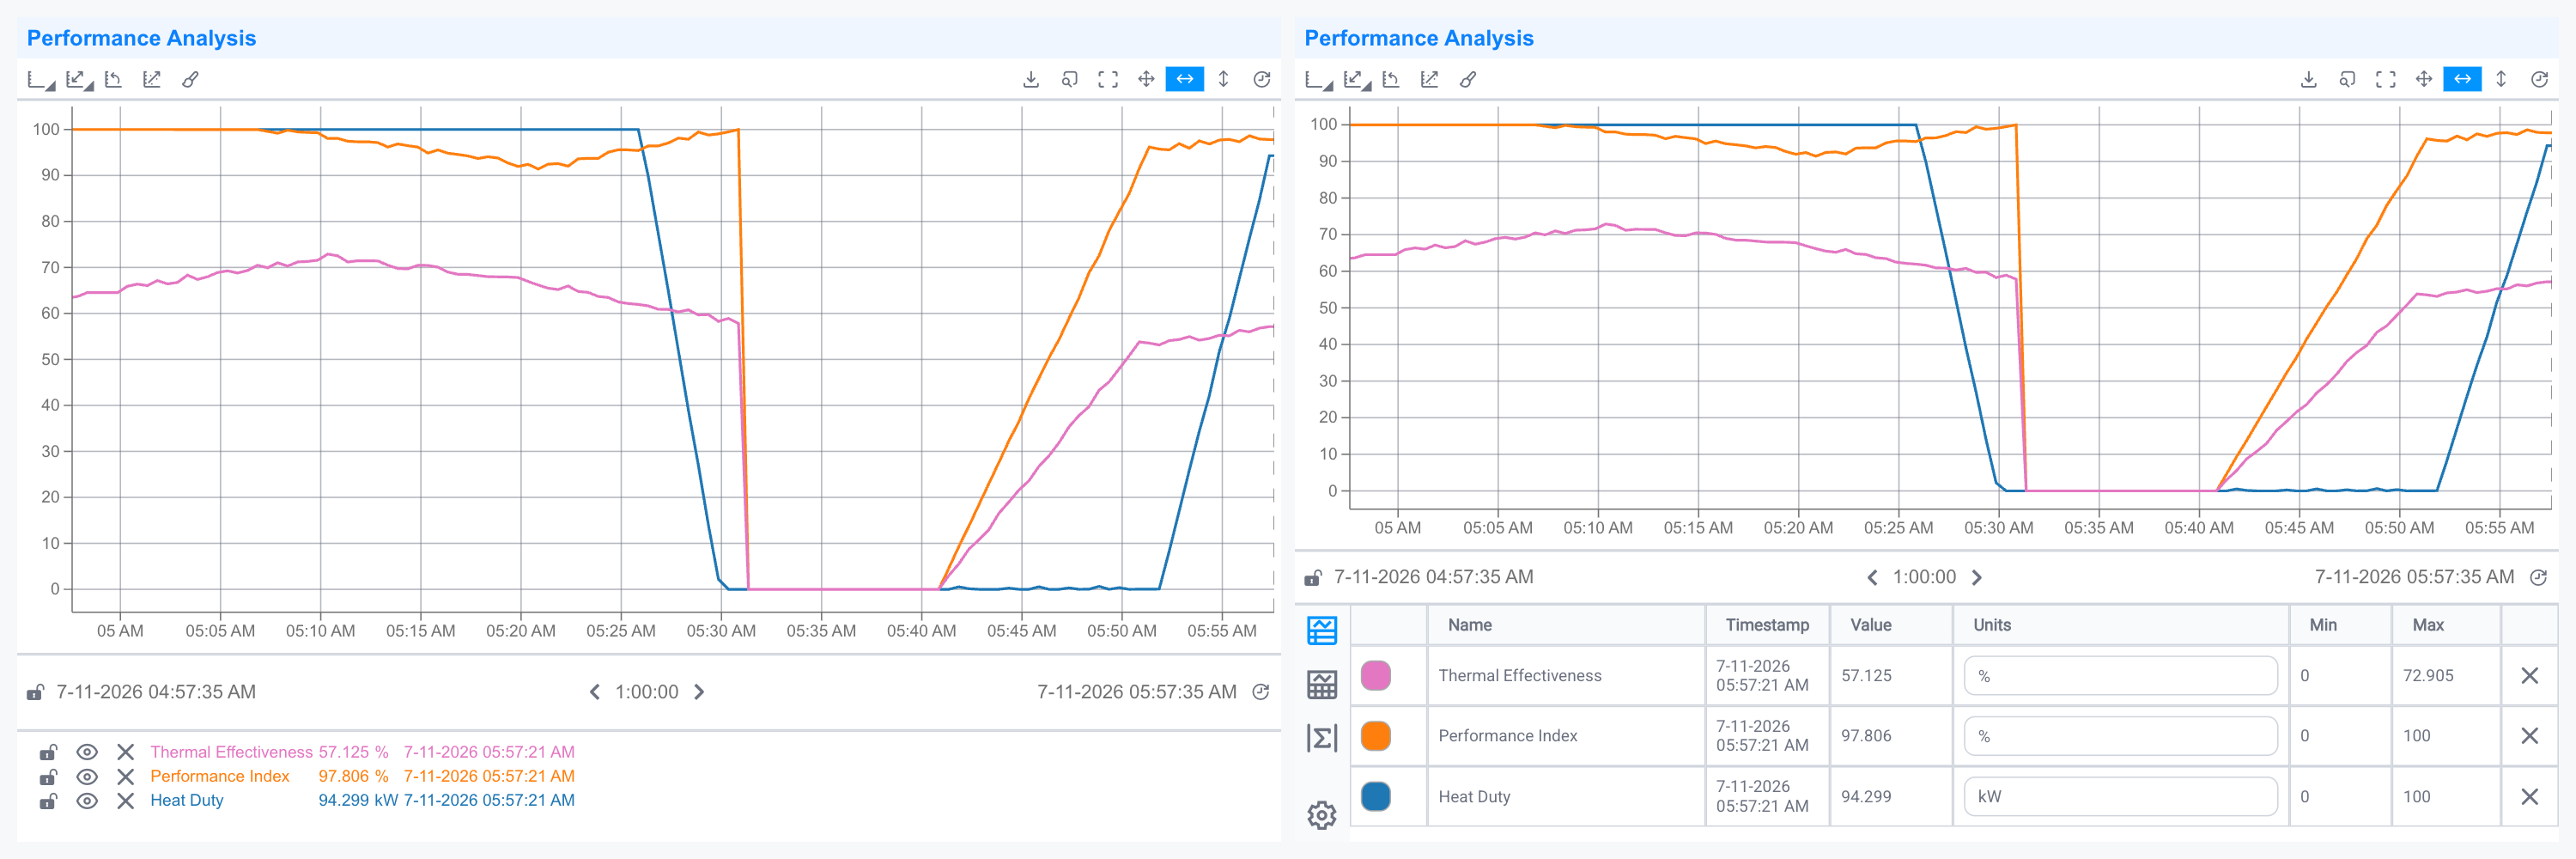
A trend's legend comes in two forms. A regular legend (left) lists each signal in a compact row with its current value; a table legend (right) expands that into a full data table with per-signal columns and the view-switch icons down the left.
Here is how a line chart can look with different legend layouts: a table legend on the right and a regular legend on the left:
The rest of this section is about the table legend. It has its own controls: a row of icons down its left edge:
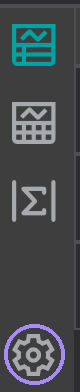
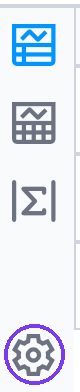
These icons switch the table legend between its views:
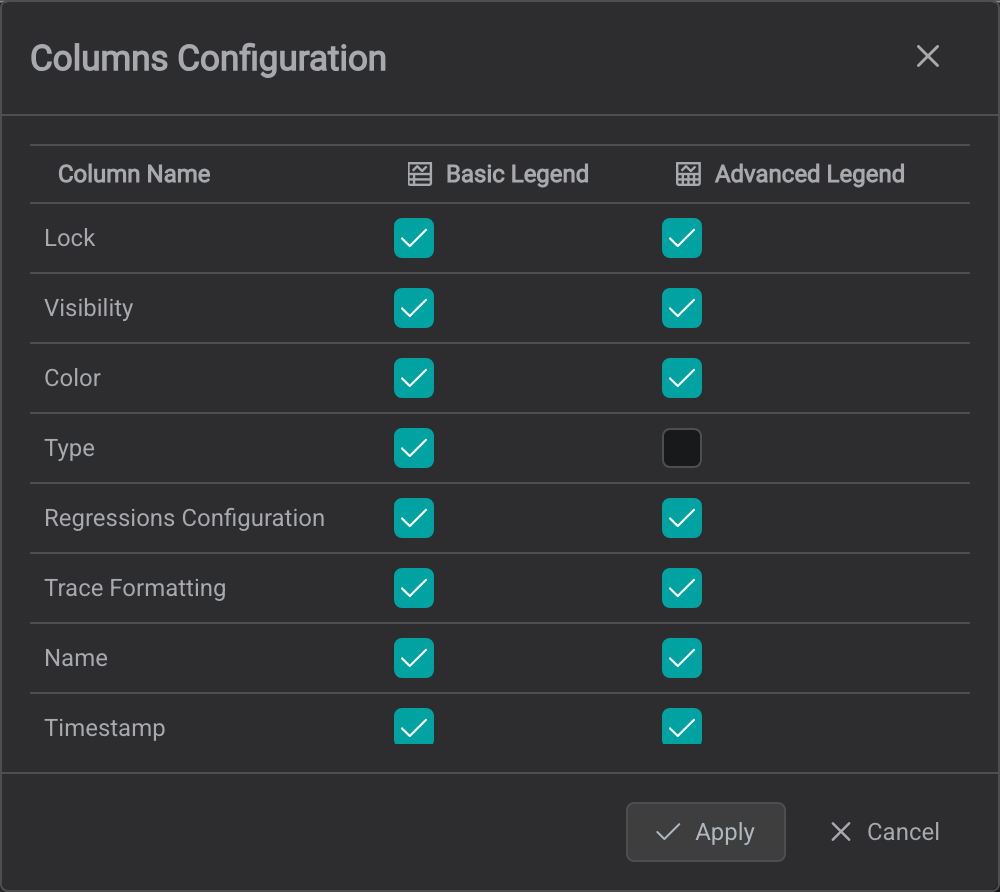
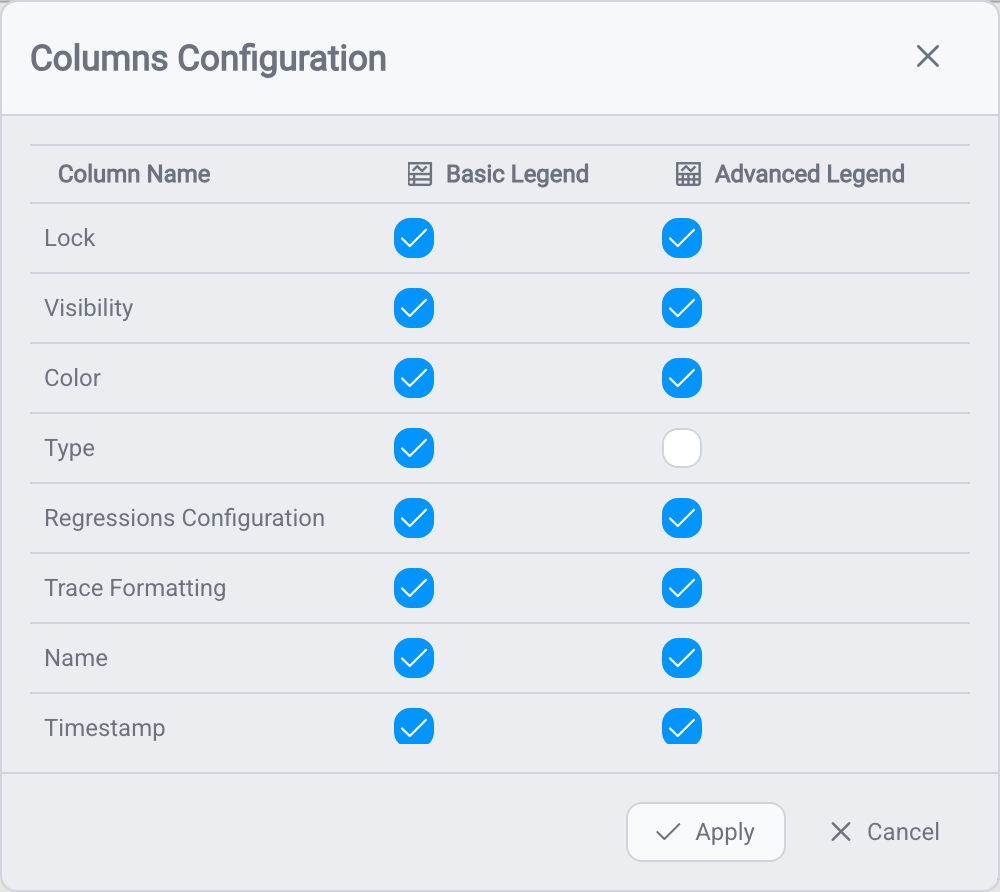
- Basic Legend and Advanced Legend: two column sets for the table. The Advanced view adds columns (such as scale bounds, average, and min/max) for deeper inspection.
- Summary (the
Σicon): summary statistics for each signal over the visible time range. - Columns Configuration (the gear icon); choose which columns appear in the Basic and Advanced views.
Choose What to Trend
Trend a Single Signal
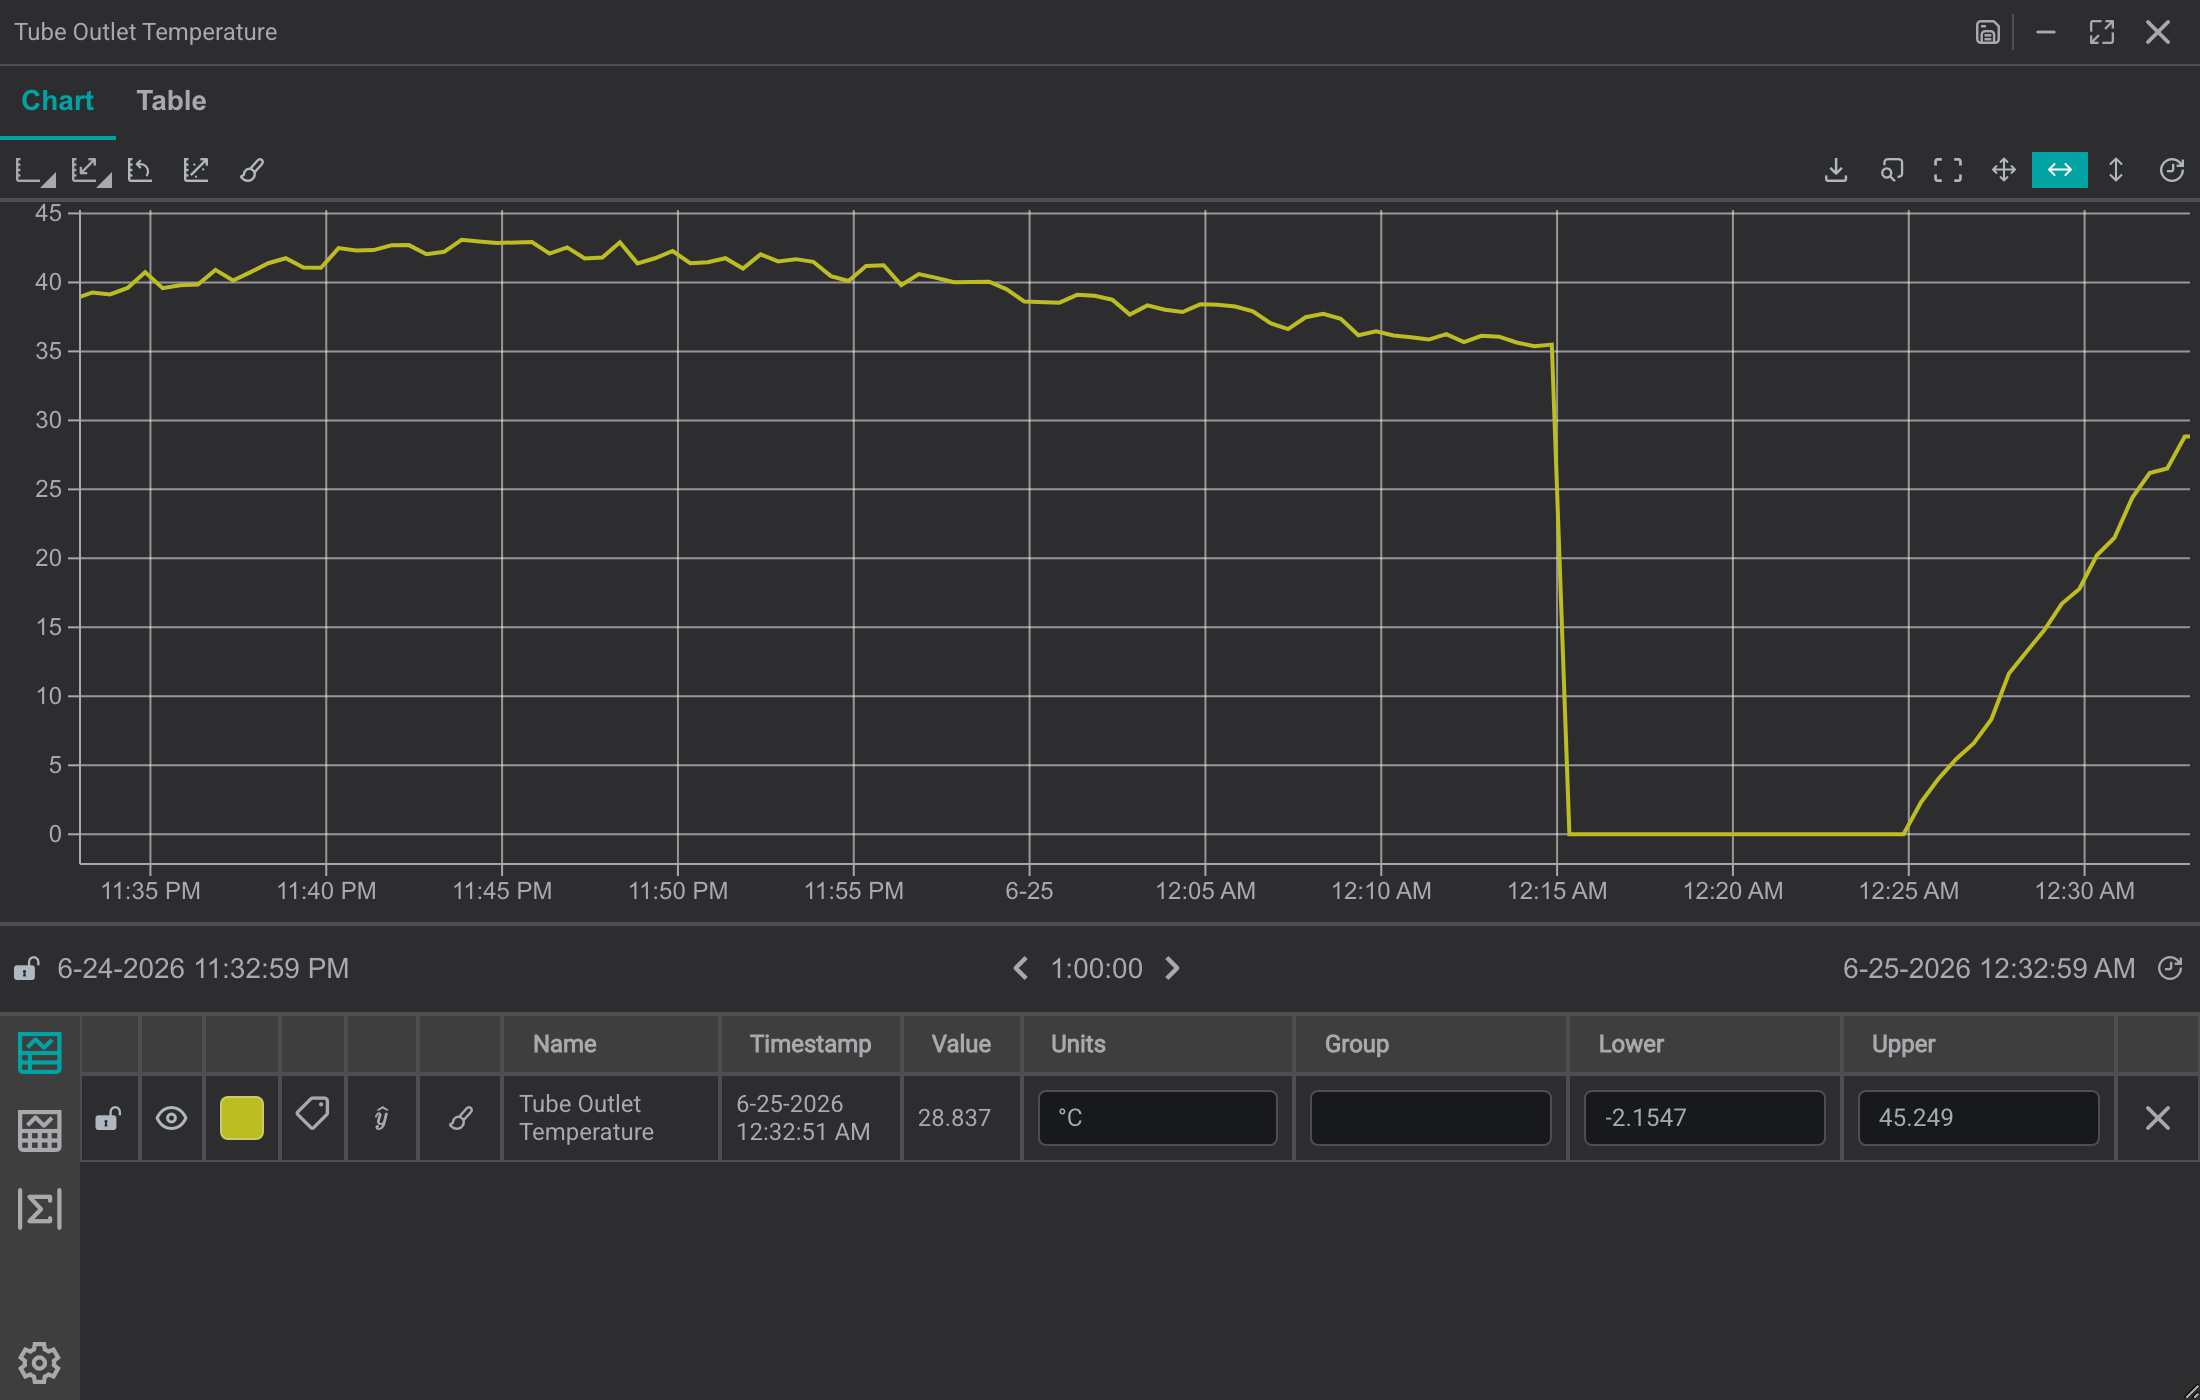
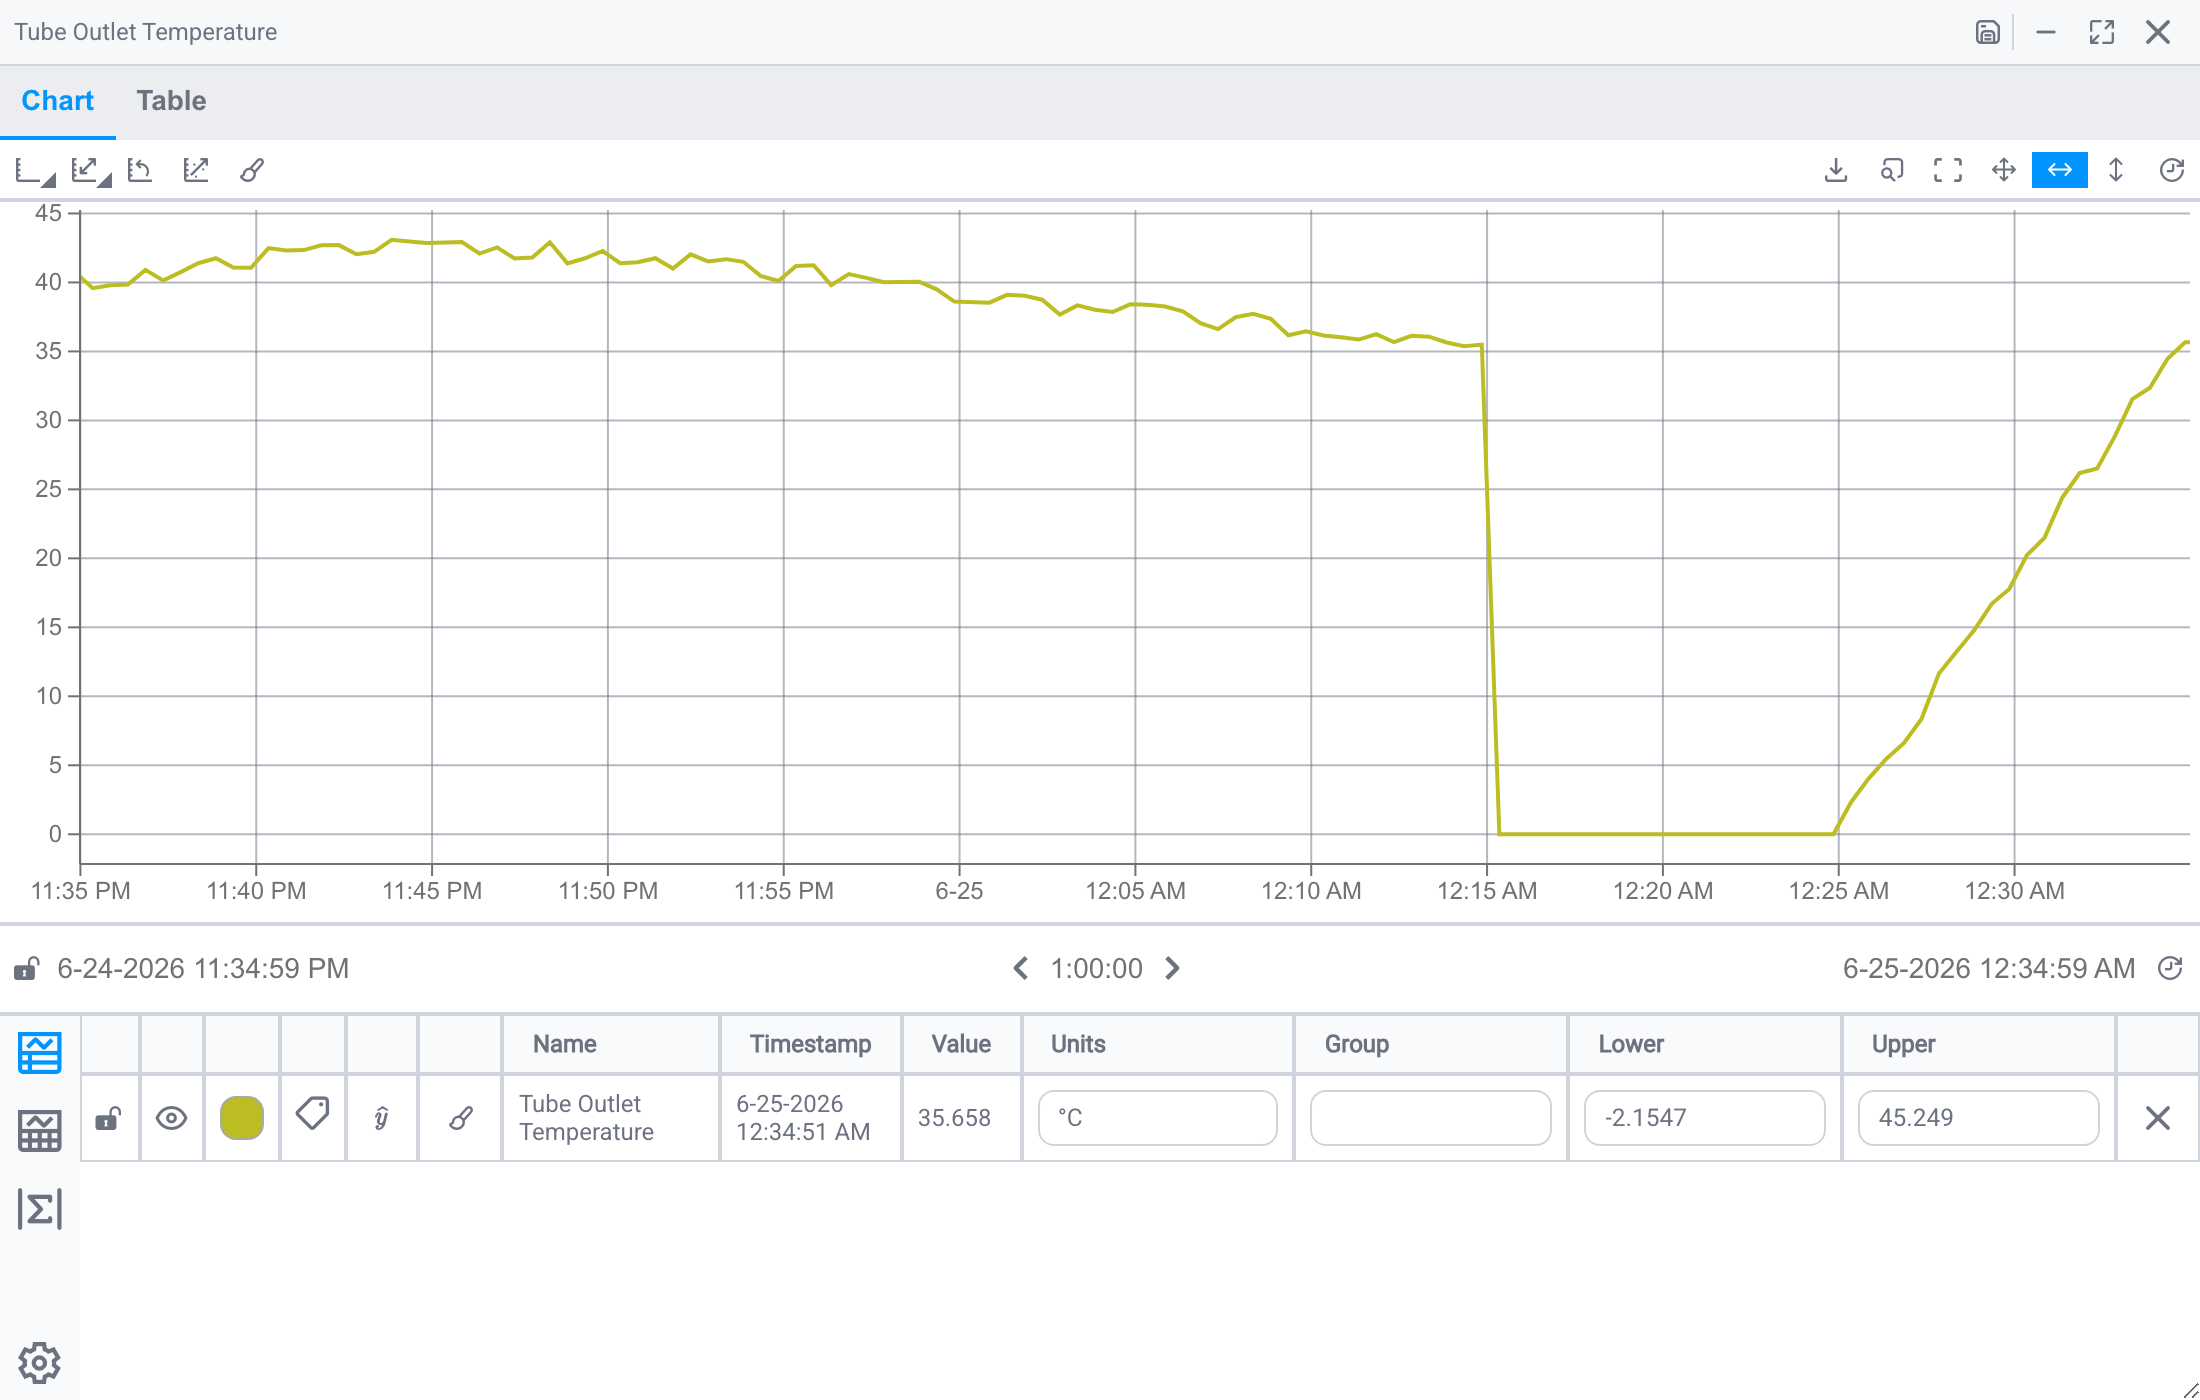
Start by opening a single signal in the ad hoc trend: either by double-clicking it, using right-click > Show Trend on a view, or dragging it from search results. Note that the ad hoc trend window is named after the signal you are trending.
- Double-click a component
- Right-click the component →
Show Trend - Cmd/Ctrl + click to select multiple components, then right-click →
Show Trend
Tips
Opening a trend from a component works only when the view is locked (view mode). In edit mode, double-click and right-click are used for building the display instead.
Compare Signals on the Display
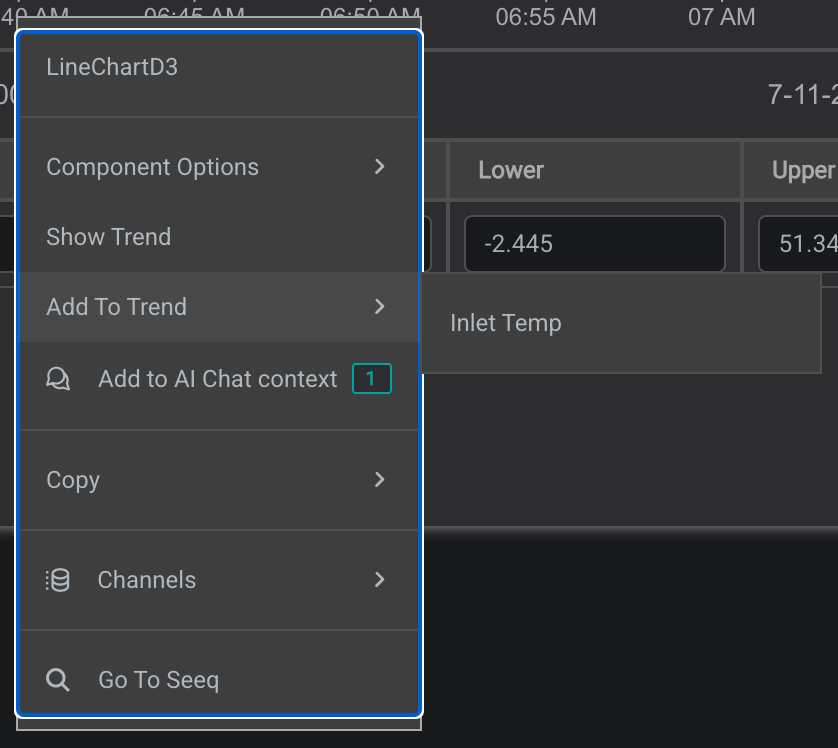
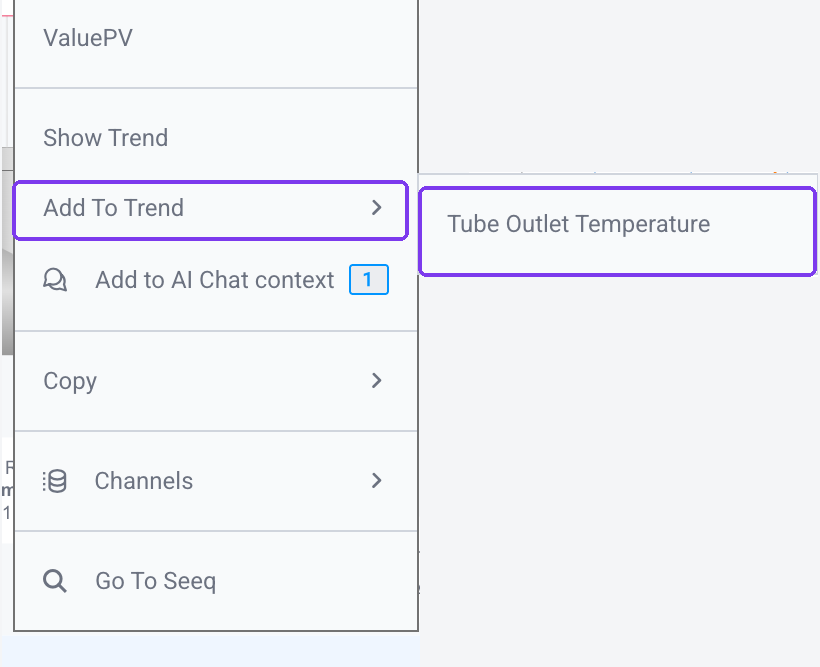
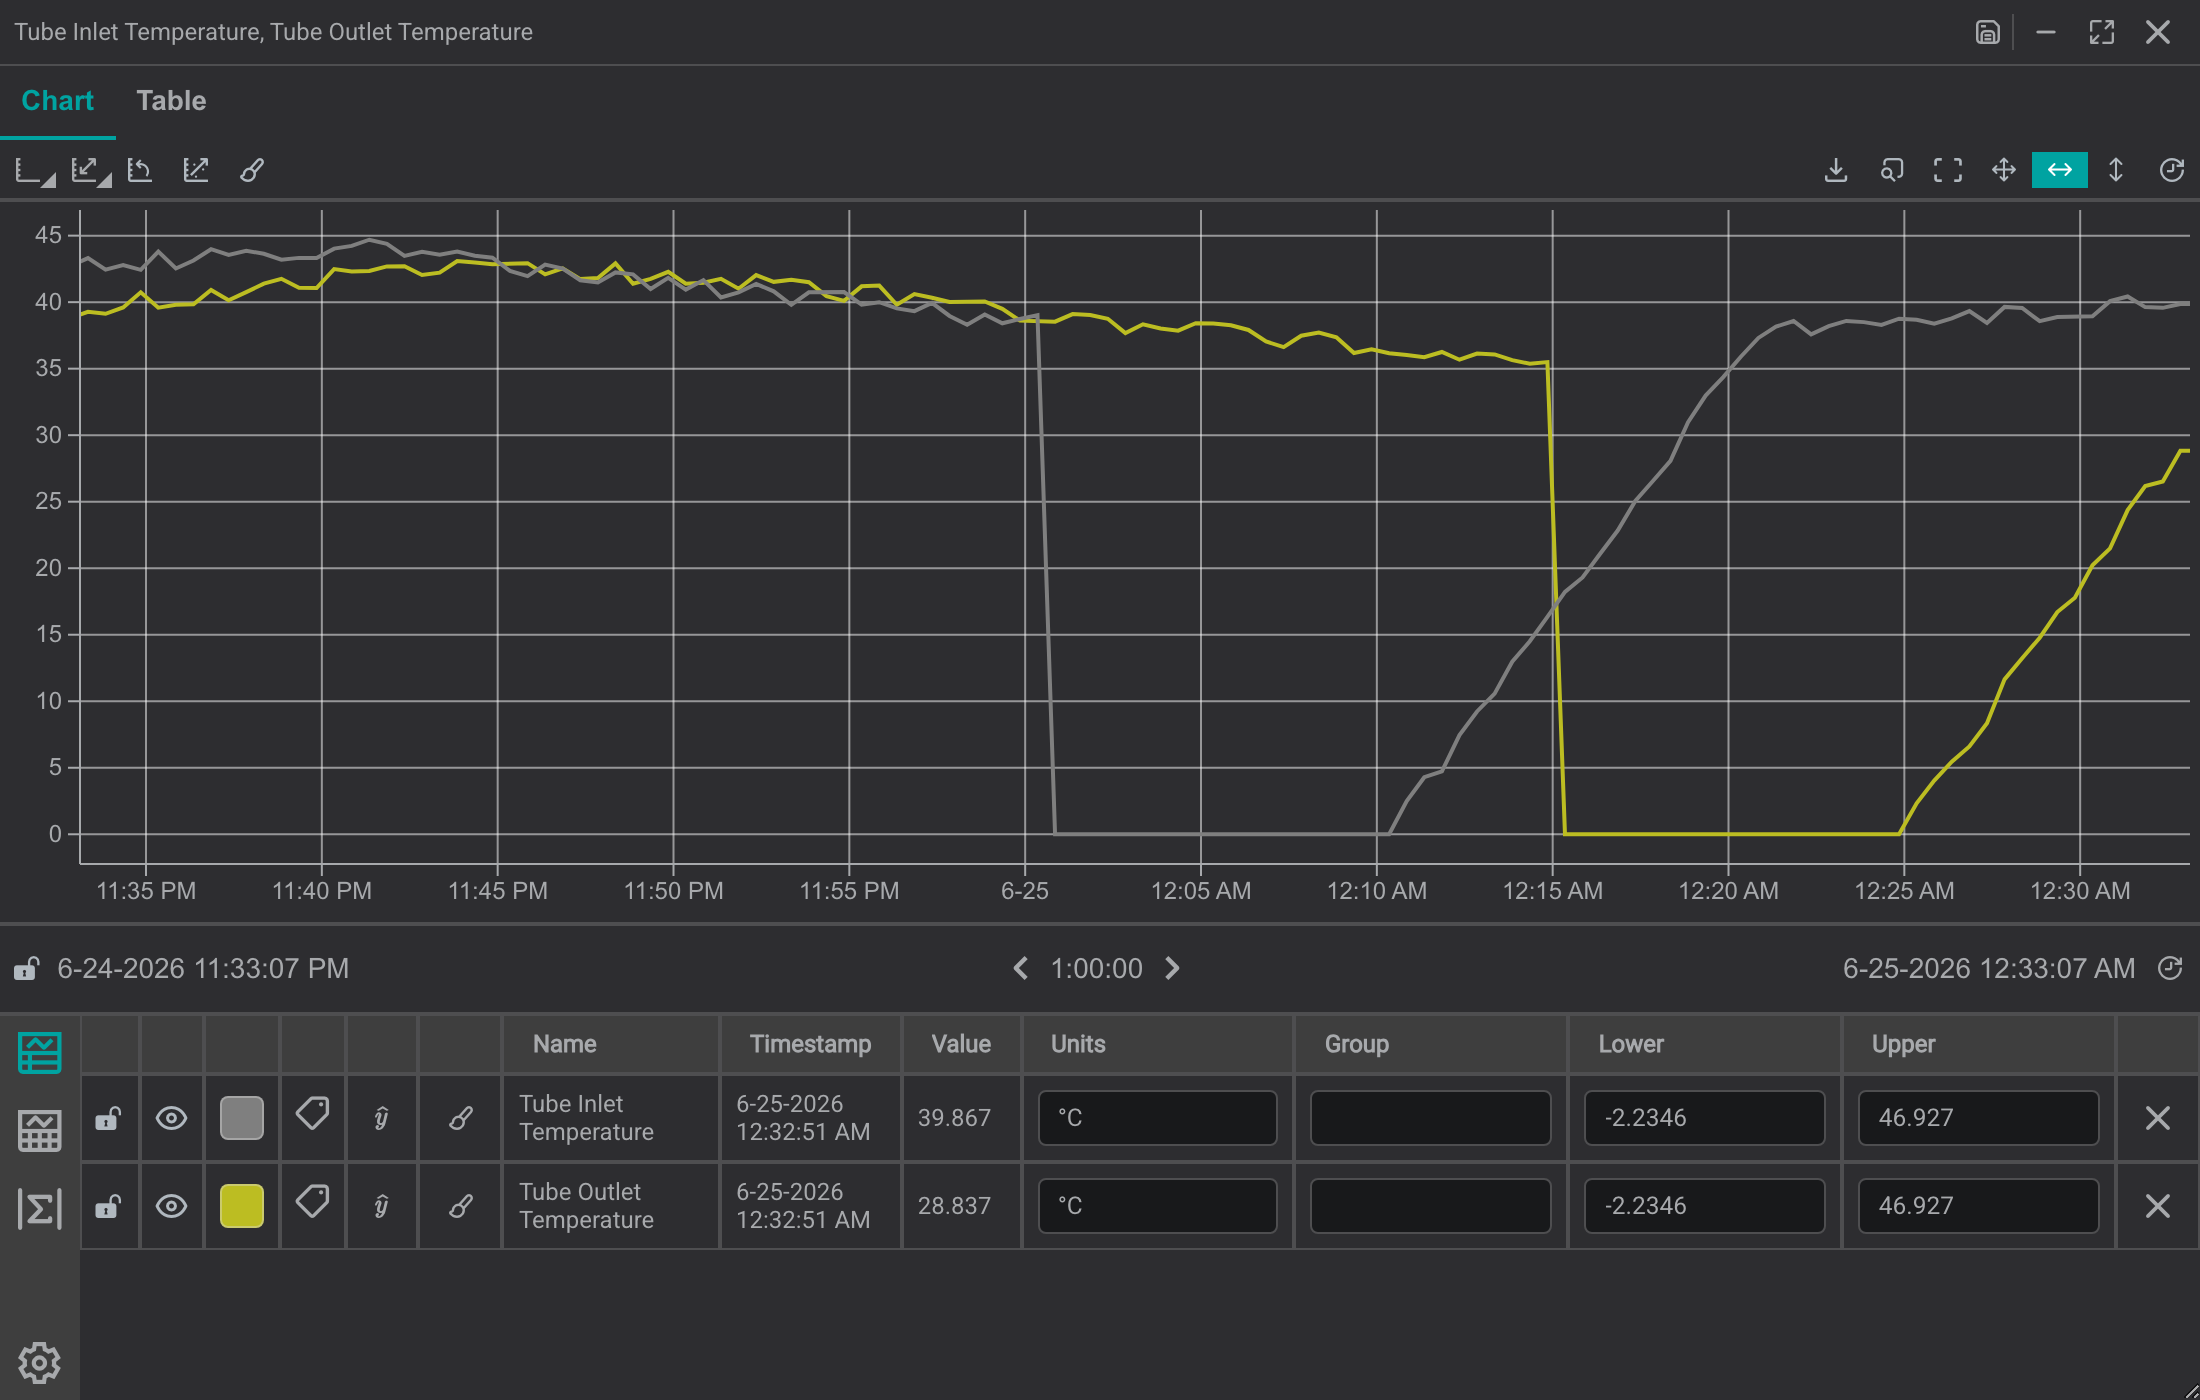
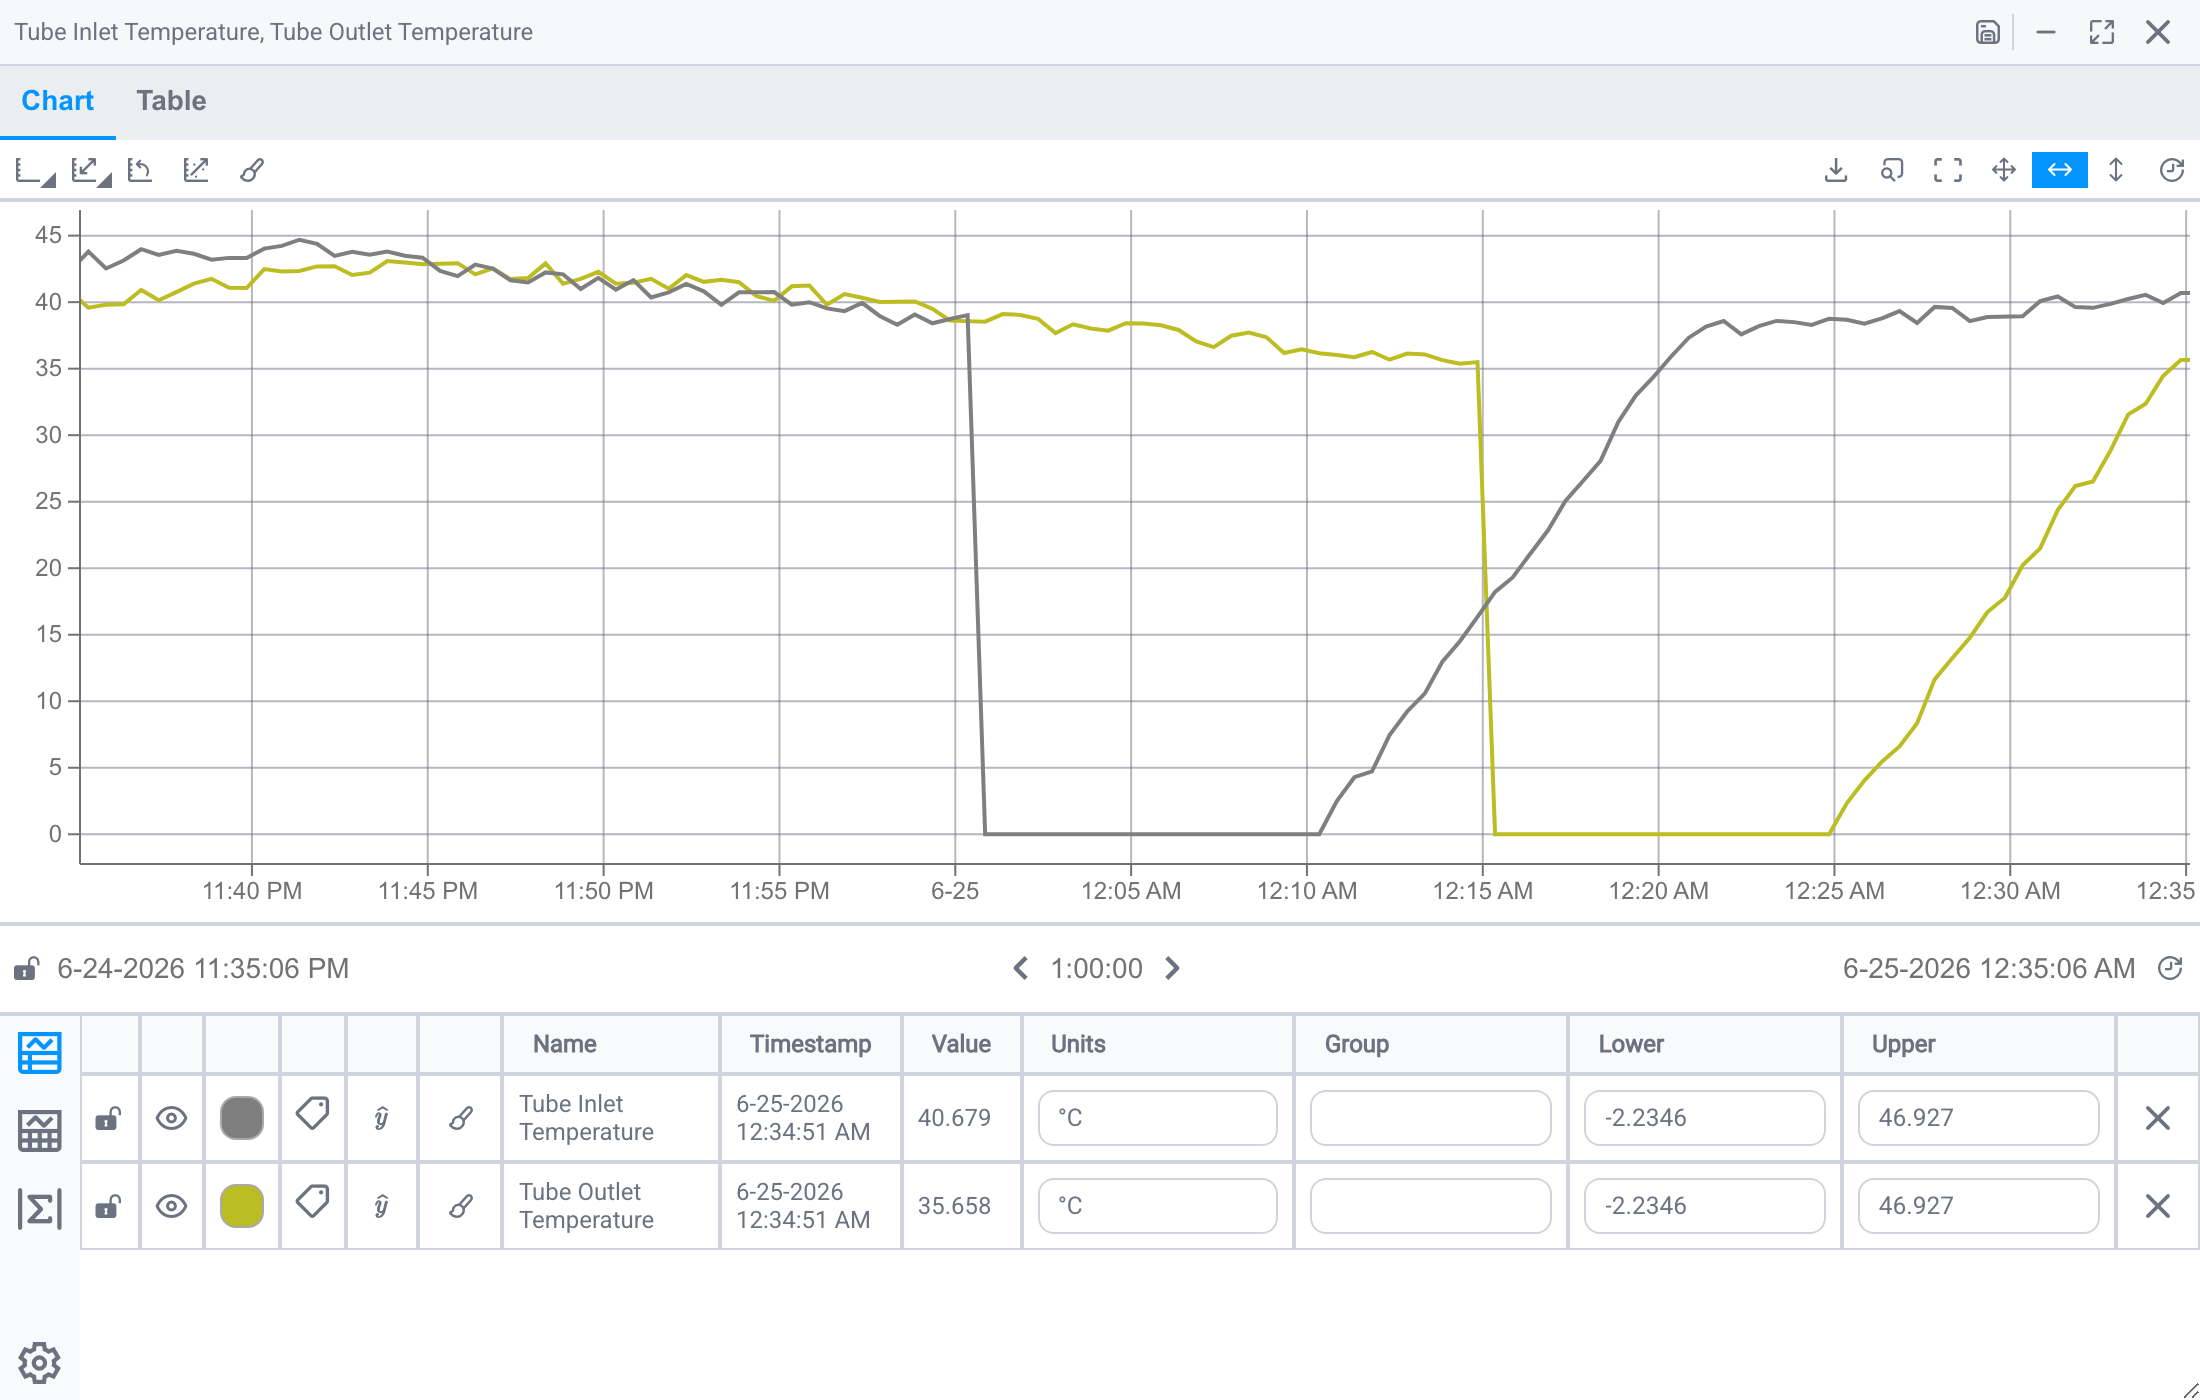
Compare signals side by side to correlate process variables. To trend signals that are already on the display, Cmd/Ctrl + click several components, then right-click → Show Trend. To add one to a trend that's already open, right-click the signal > Add to Trend and choose the trend by name (the trend window is named after its first signal).
Add More Signals from Search
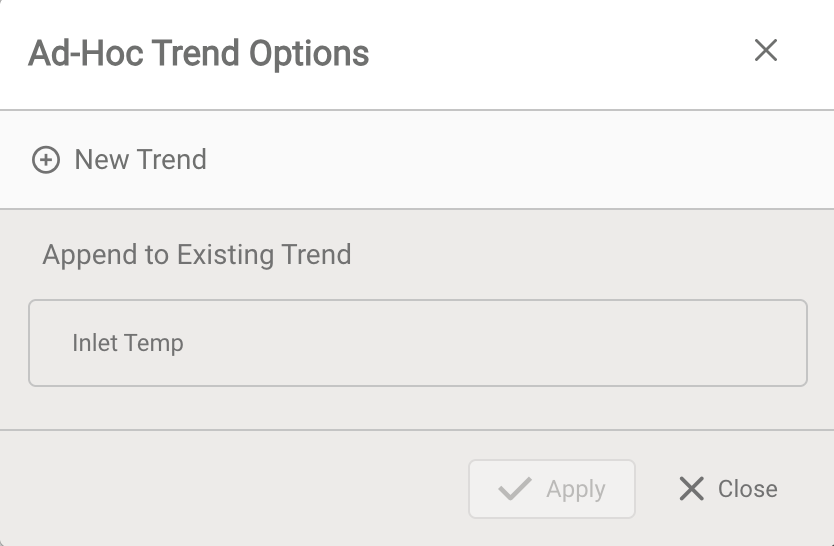
If a signal you want to compare isn't on the current display, find it with Search (see Finding Data to Trend) and add it to the open trend. From the search results, drag the signal onto the trend, or double-click / right-click it and choose Append to Existing Trend, then pick the trend.
Set the Time Range
Explore Data During a Past Time Period
To investigate something that already happened, set the trend's window with the time control at the bottom of the trend. Open it to enter a specific start and end time, pick a preset duration, or step backward and forward with the ‹ › arrows. The chart redraws for the selected range, so you can focus on exactly when an event occurred.


Watch for Real-Time Updates
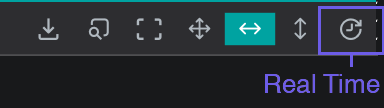
To follow a process as it runs, turn on Real Time in the trend controls. IOTA appends new readings at the right edge as they arrive and slides the window forward automatically. How soon each new point appears depends on the data source and its driver (some stream continuously, others poll on an interval), so the update cadence varies by connection.
Find Last Available Data for a Stale Signal
If you open an ad hoc trend and data is not available for the selected time range, check the timestamp of the trace in the legend and use time controls to select that as the end time. A faster way is to use the Find Data shortcut in the trend controls.


Tips
With signals trended and the time range set, continue to Customizing a Trend to adjust how the traces are drawn.
What's Next
With signals on the chart, continue to Customizing a Trend to make multiple traces legible: colors, plot types, and scales.
Related
- Customizing a Trend: style traces and scales
- Finding Data to Trend: locate signals to add
- Analyzing a Trend: read exact values and patterns