
Analyzing a Trend
Analyzing a Trend
With a trend built and customized, use these techniques to read exact values and surface patterns: place cursors, compare statistics, zoom into events, color out-of-spec periods, and overlay regression and limit lines.
Inspect Exact Values
Place Cursors to Inspect Values
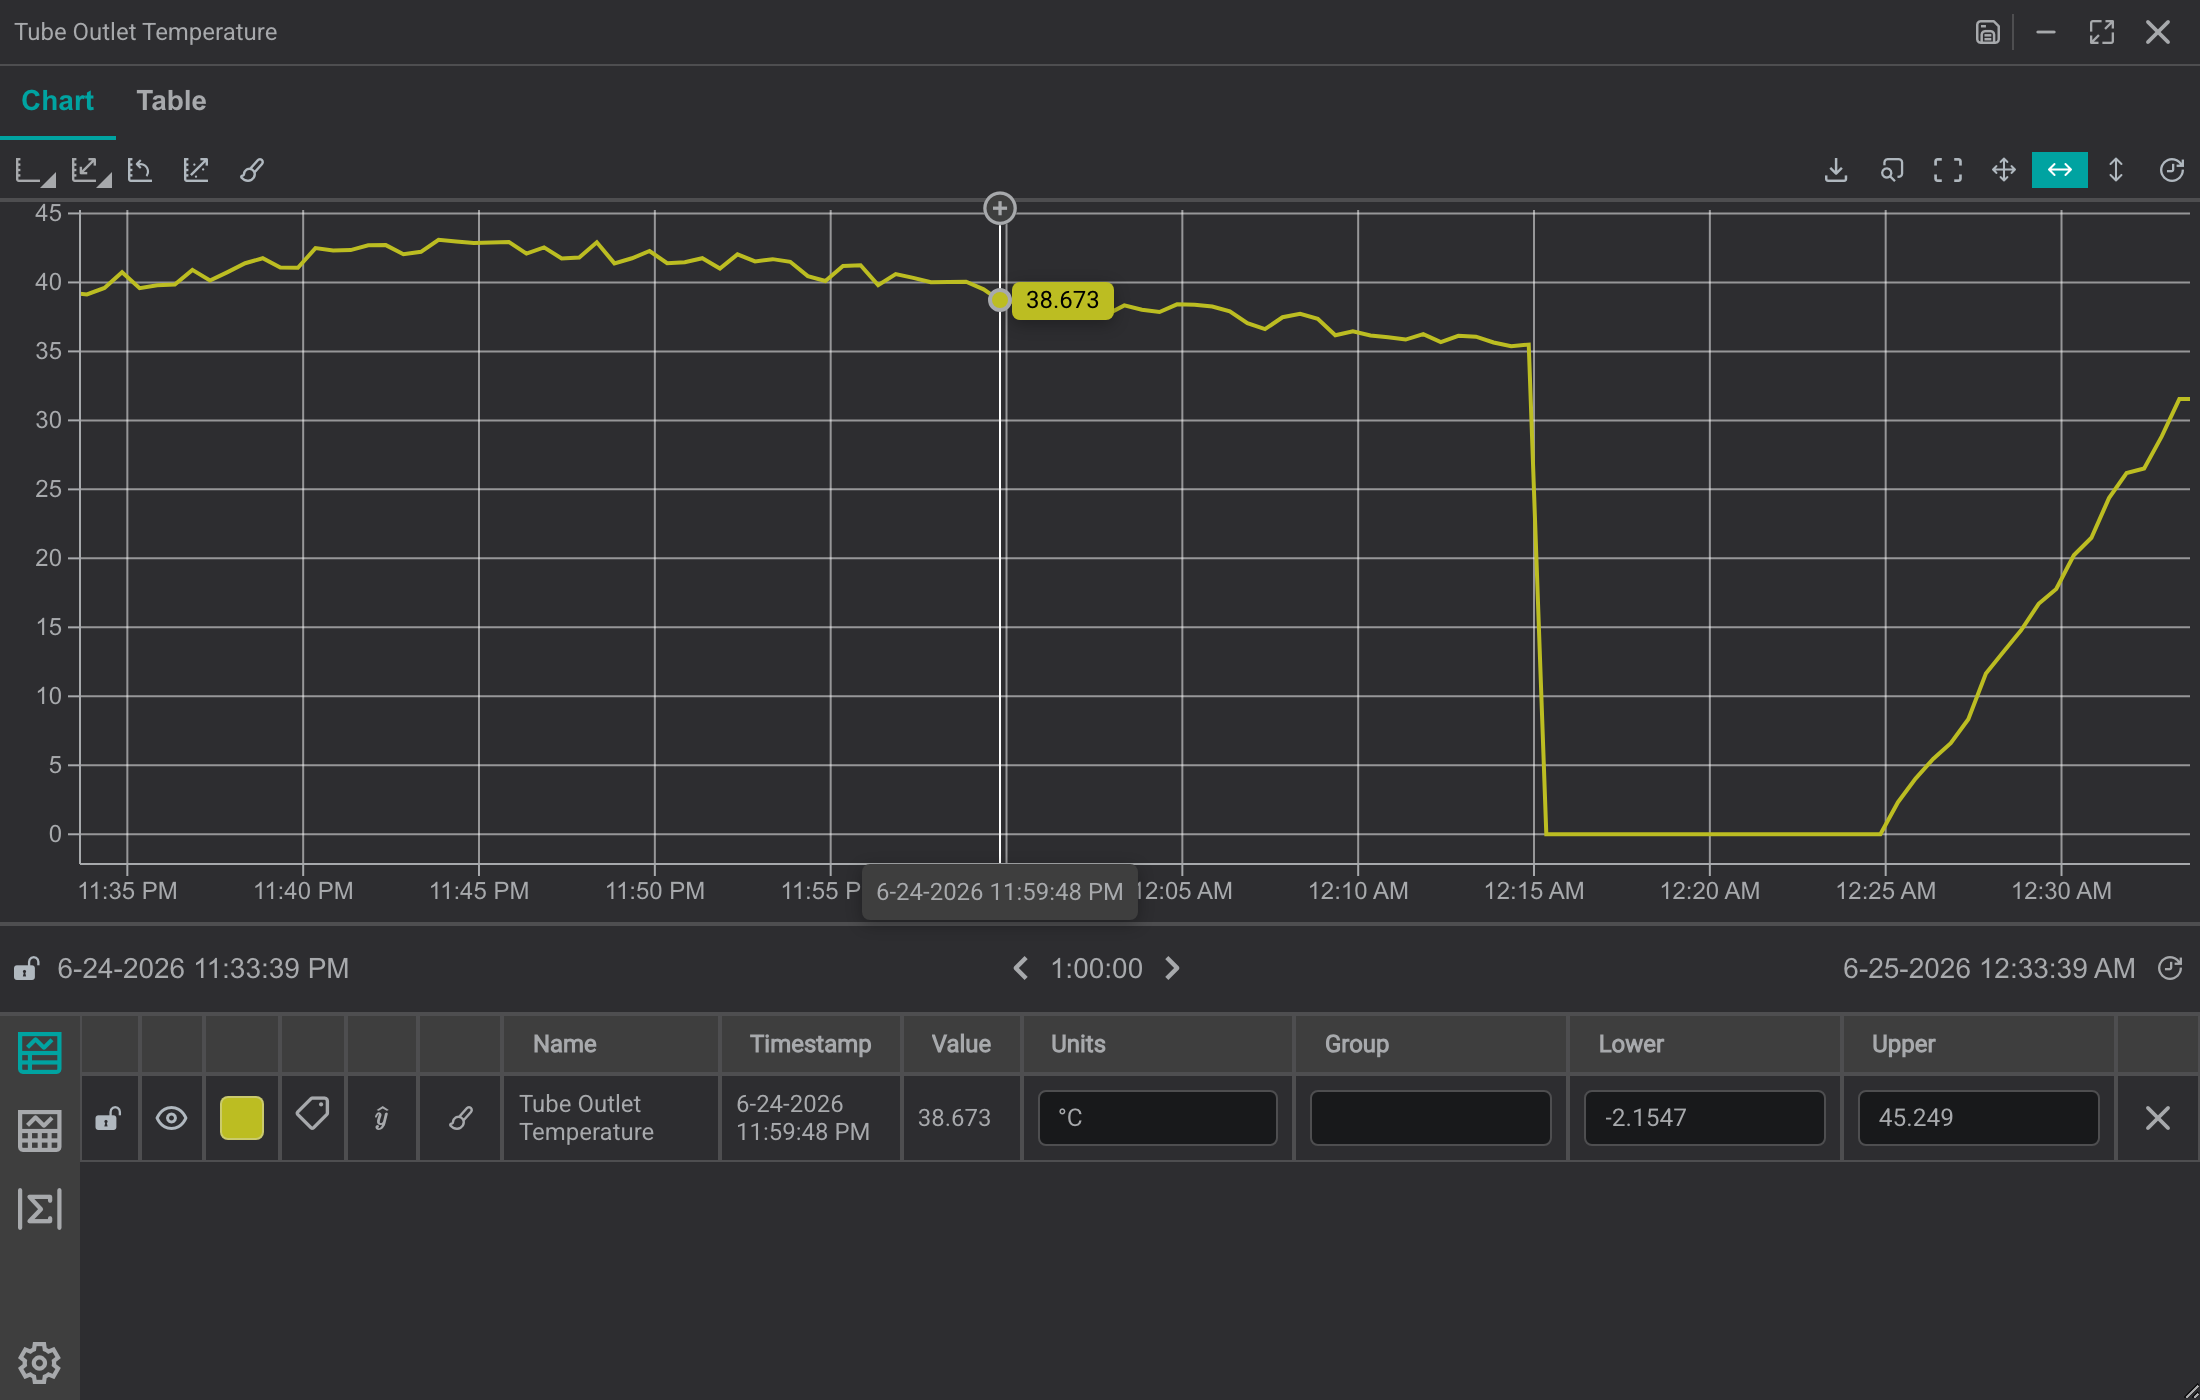
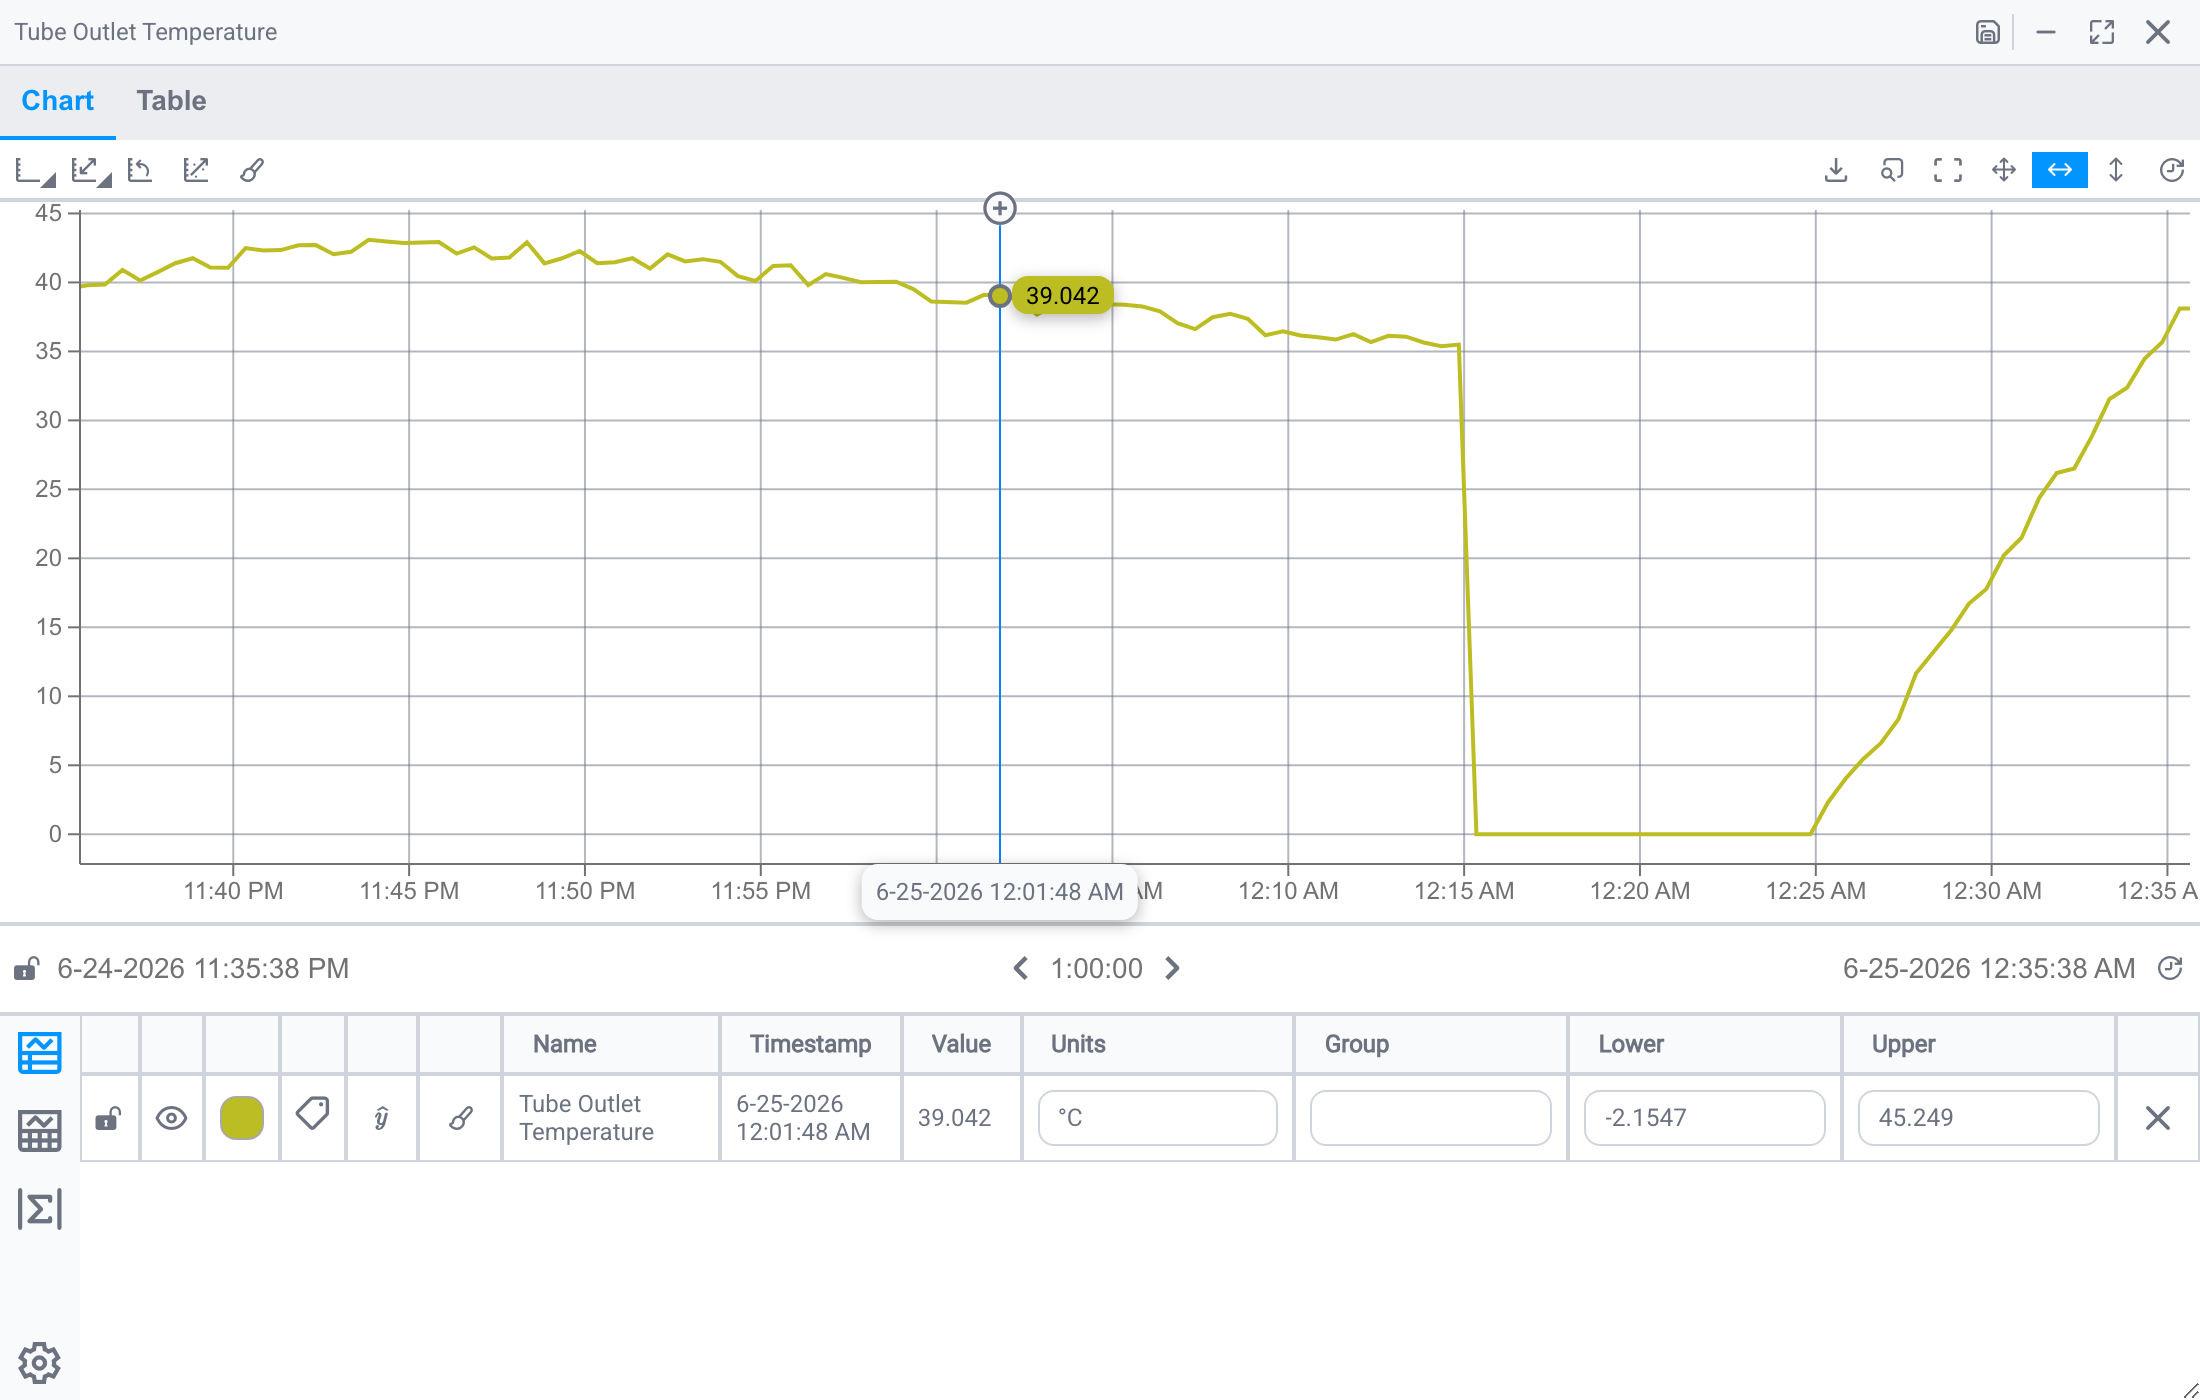
Place cursors on the trend using the + button to read exact values at specific points in time. Cursors display the value and timestamp for each signal.
Compare Statistics Between Cursors
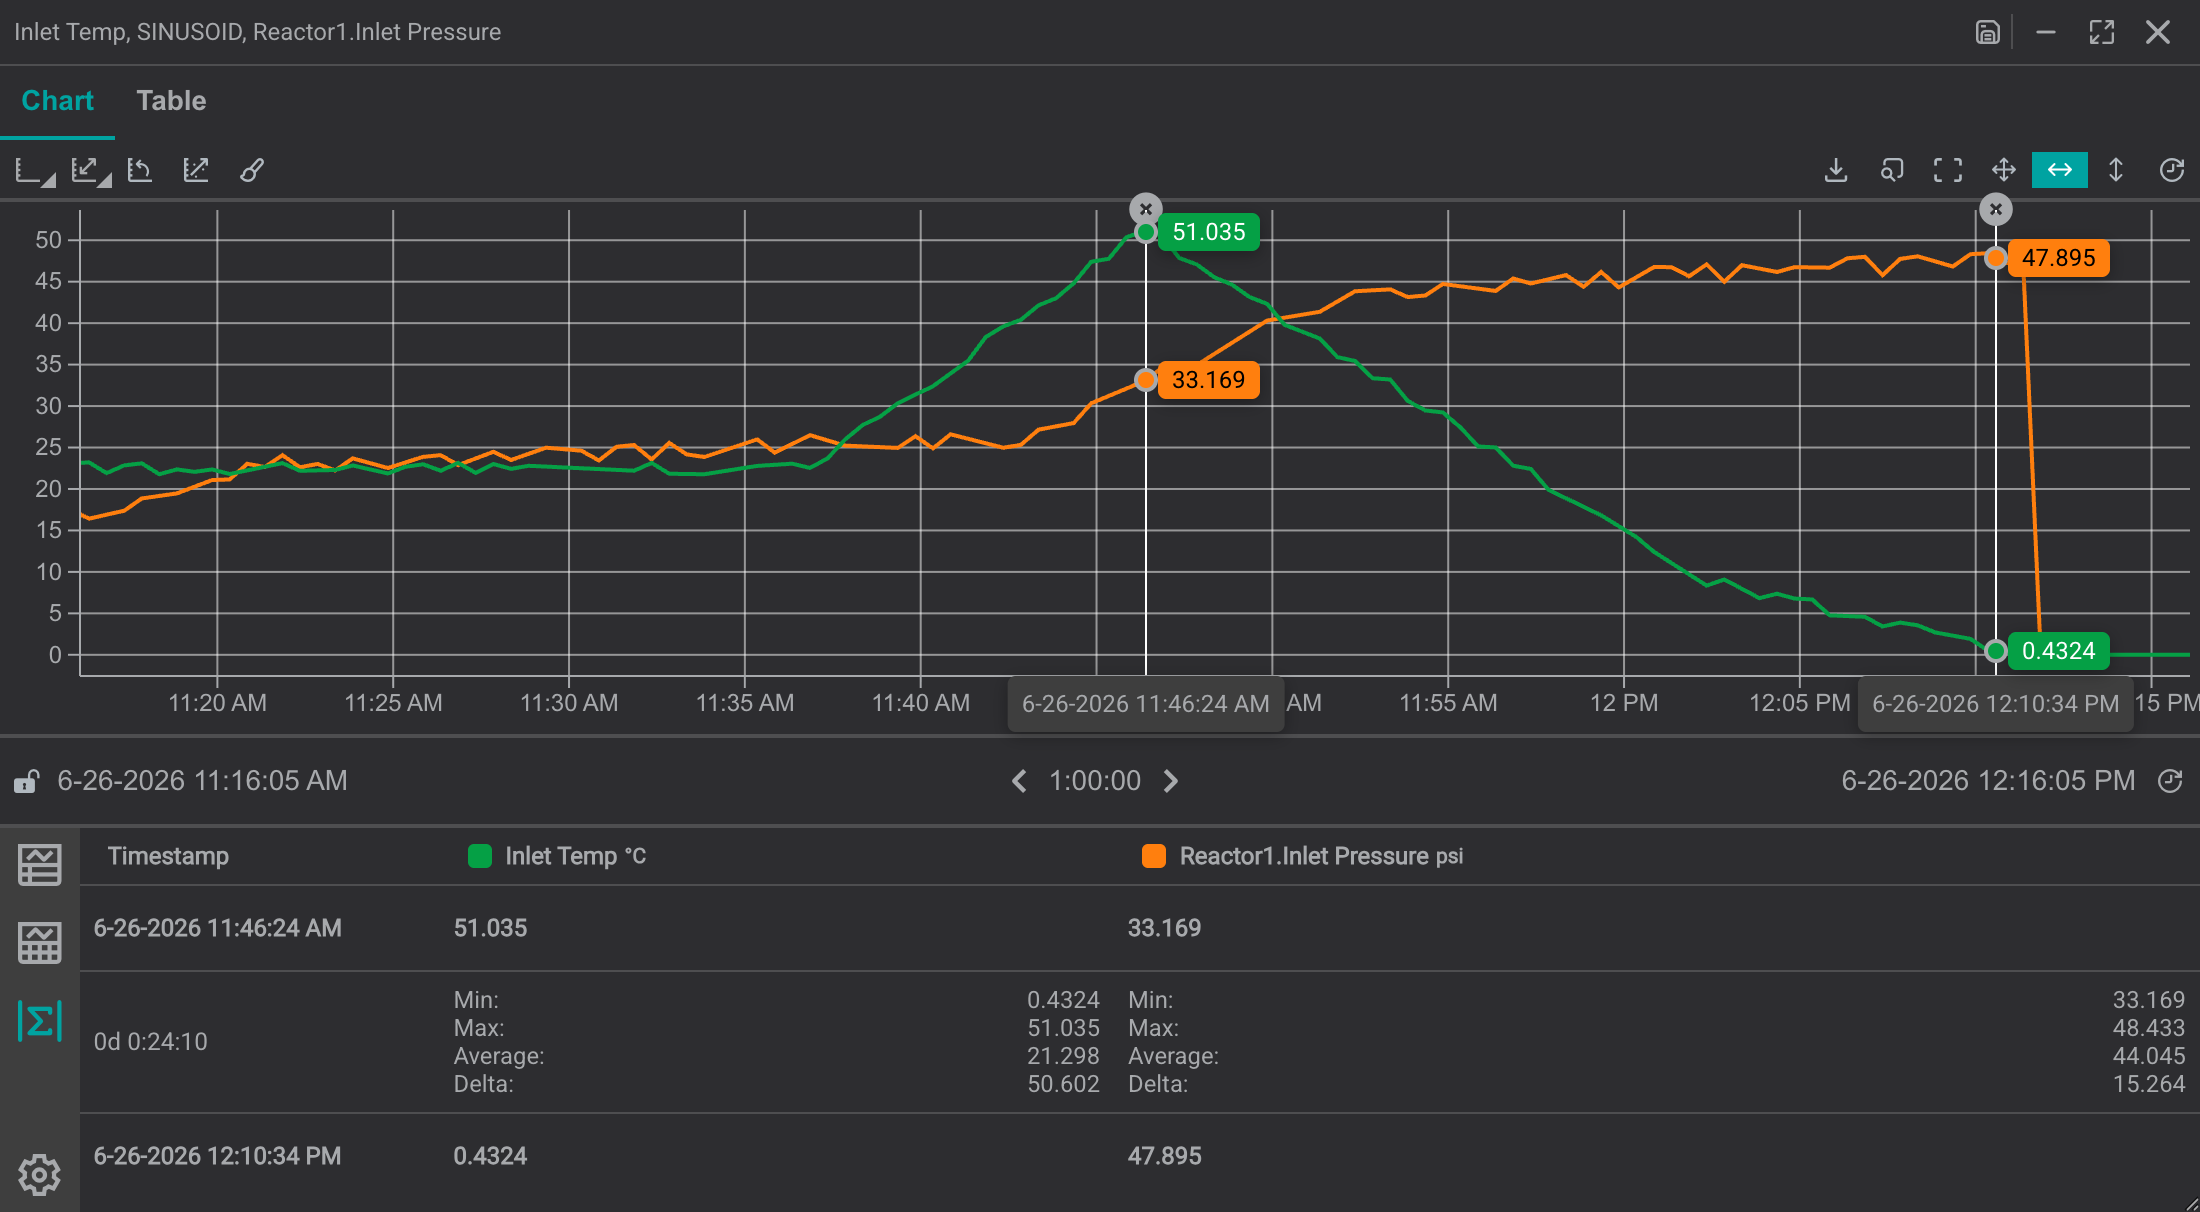
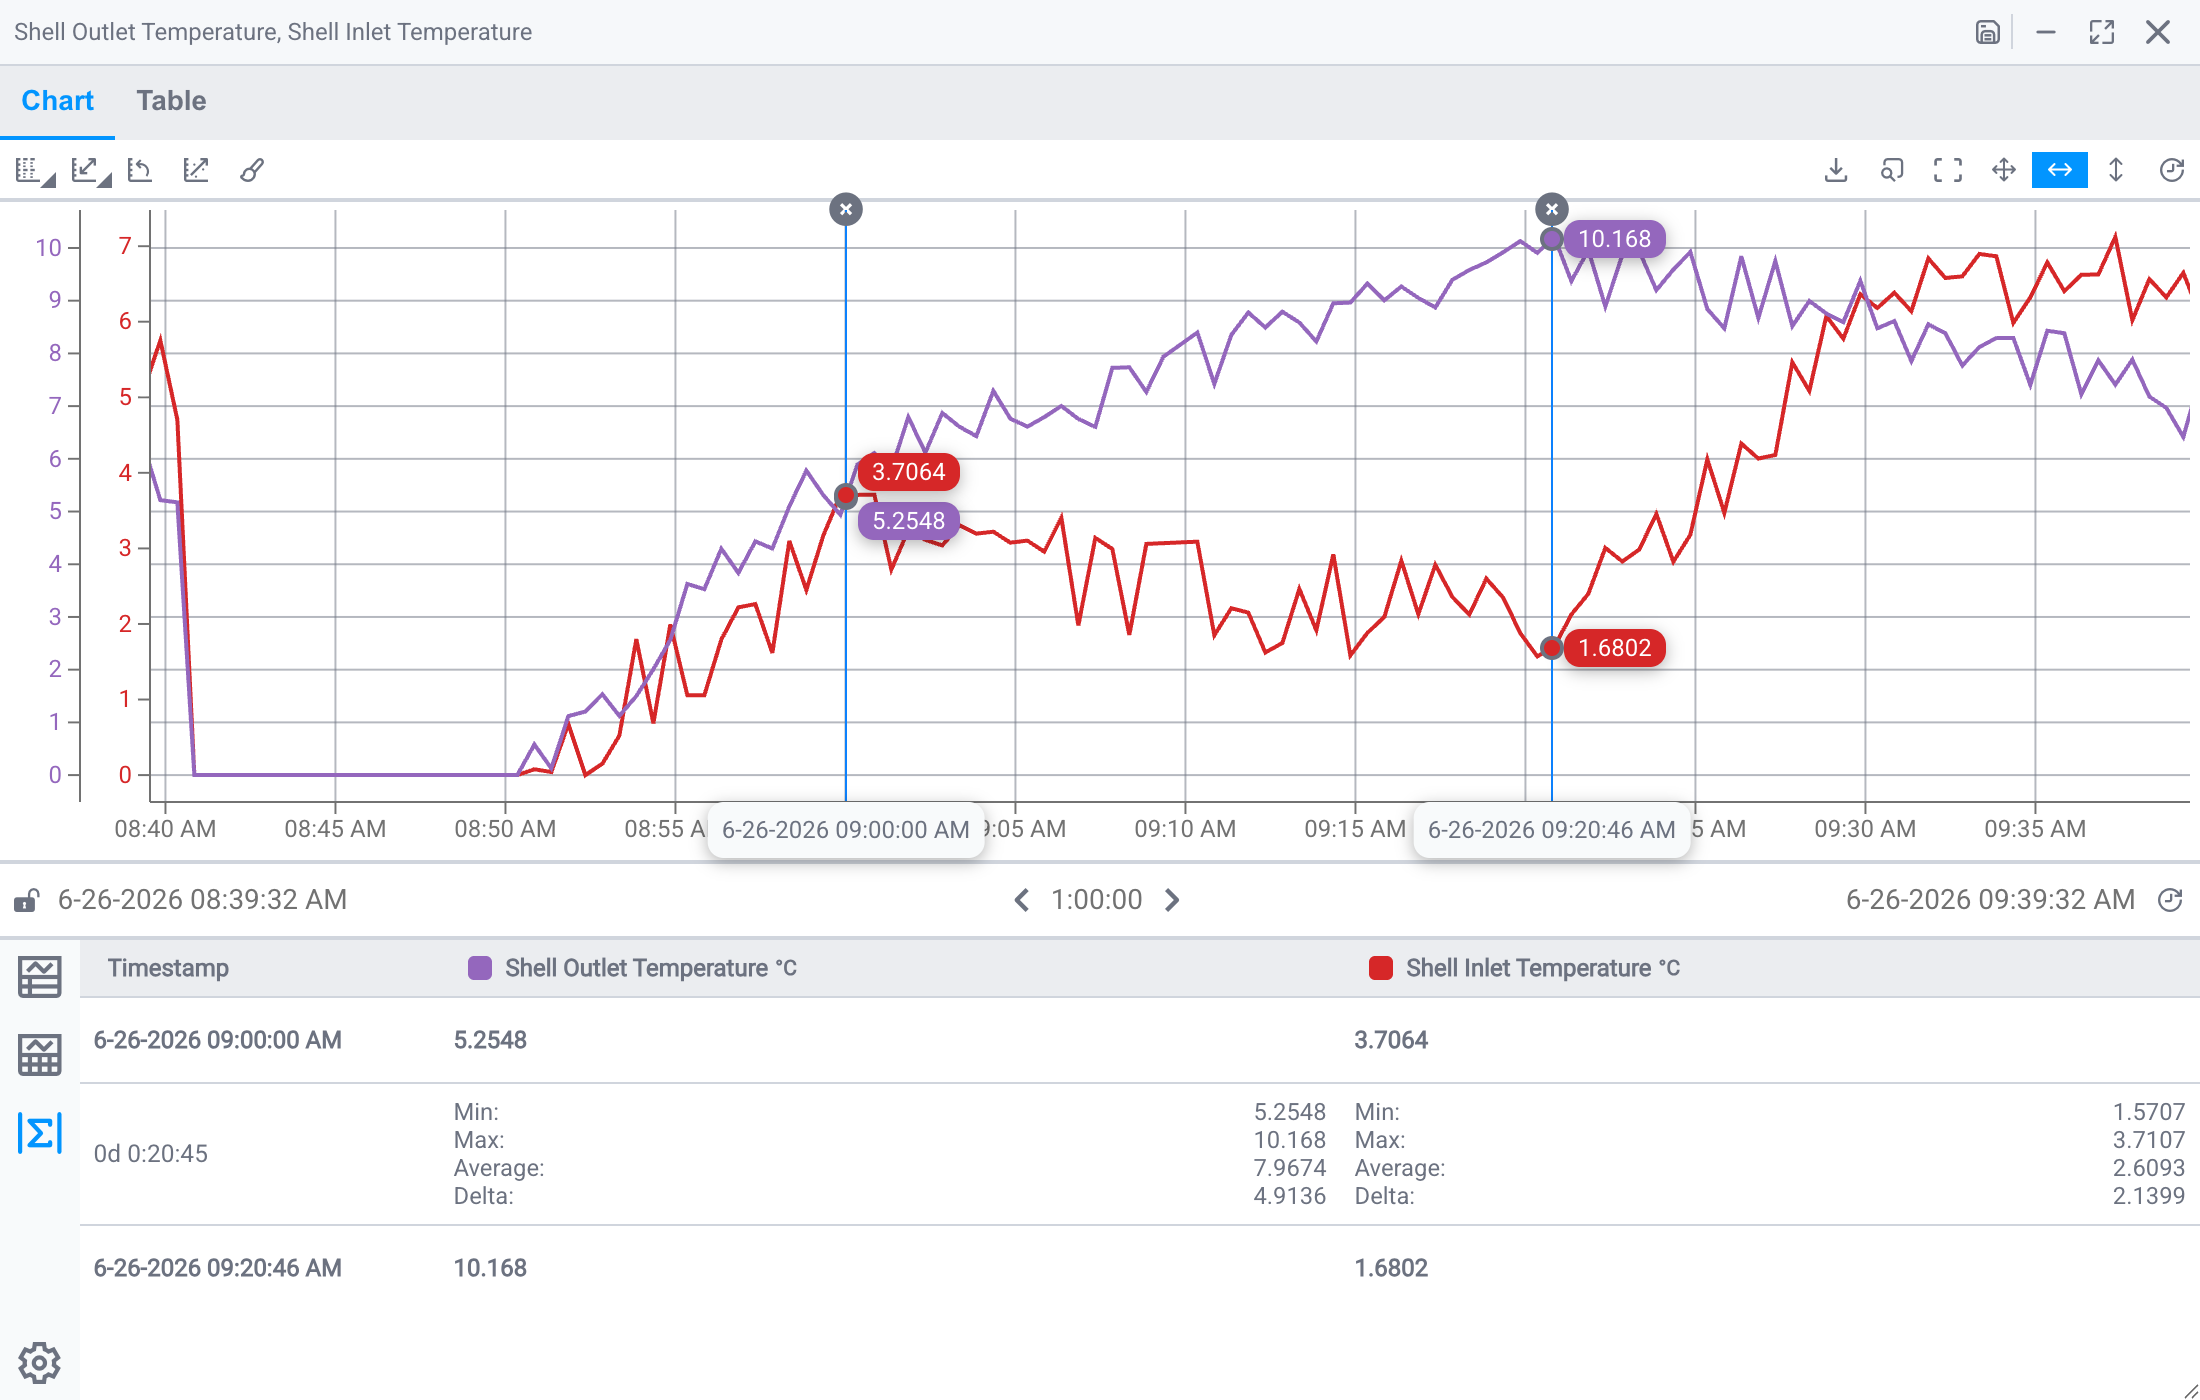
With two cursors placed, compare statistics (min, max, average, delta) for the selected time range across all trended signals.
Find & Highlight Patterns
Identify a Spike or Unusual Event
Use the trend to spot anomalies such as spikes, drops, or unexpected patterns in your data.
The trend toolbar gives you several ways to zoom in and inspect a region:


- Area selection: drag a box on the trend to zoom into a specific region
- Multi-directional: pan and zoom freely in any direction
- Horizontal: constrain zoom and pan to the time (X) axis
- Vertical: constrain zoom and pan to the value (Y) axis
In the horizontal, vertical, and multi-directional modes, use the mouse scroll over the trend area to zoom. Scrolling over a specific scale axis (X for time, Y for values) zooms that scale only.
A few behaviors to keep in mind while zooming:
- Double-click the trend to undo the last Area selection zoom.
- Zooming with Area selection or in Vertical mode switches the affected scales to fixed (custom) limits: you'll see the Lower and Upper values update in the table legend. Use Reset Scale to return to automatic bounds.
- Zooming or scrolling turns Real Time off, since following live data conflicts with a fixed view.
- Turning Real Time on clears any cursors you've placed.
Compare Signals Recorded at Different Times
To line up an event that appears in two signals at different times, or to compare the shape of a signal now against how it behaved earlier, lock a signal so it stays fixed while you scroll the others. Click the lock icon on a signal's row in the table legend: locked signals hold their time position when you scroll the time axis, while unlocked signals move, so you can slide one trace until its features align with another. Click the icon again to unlock.


Highlight Out-of-Spec Areas
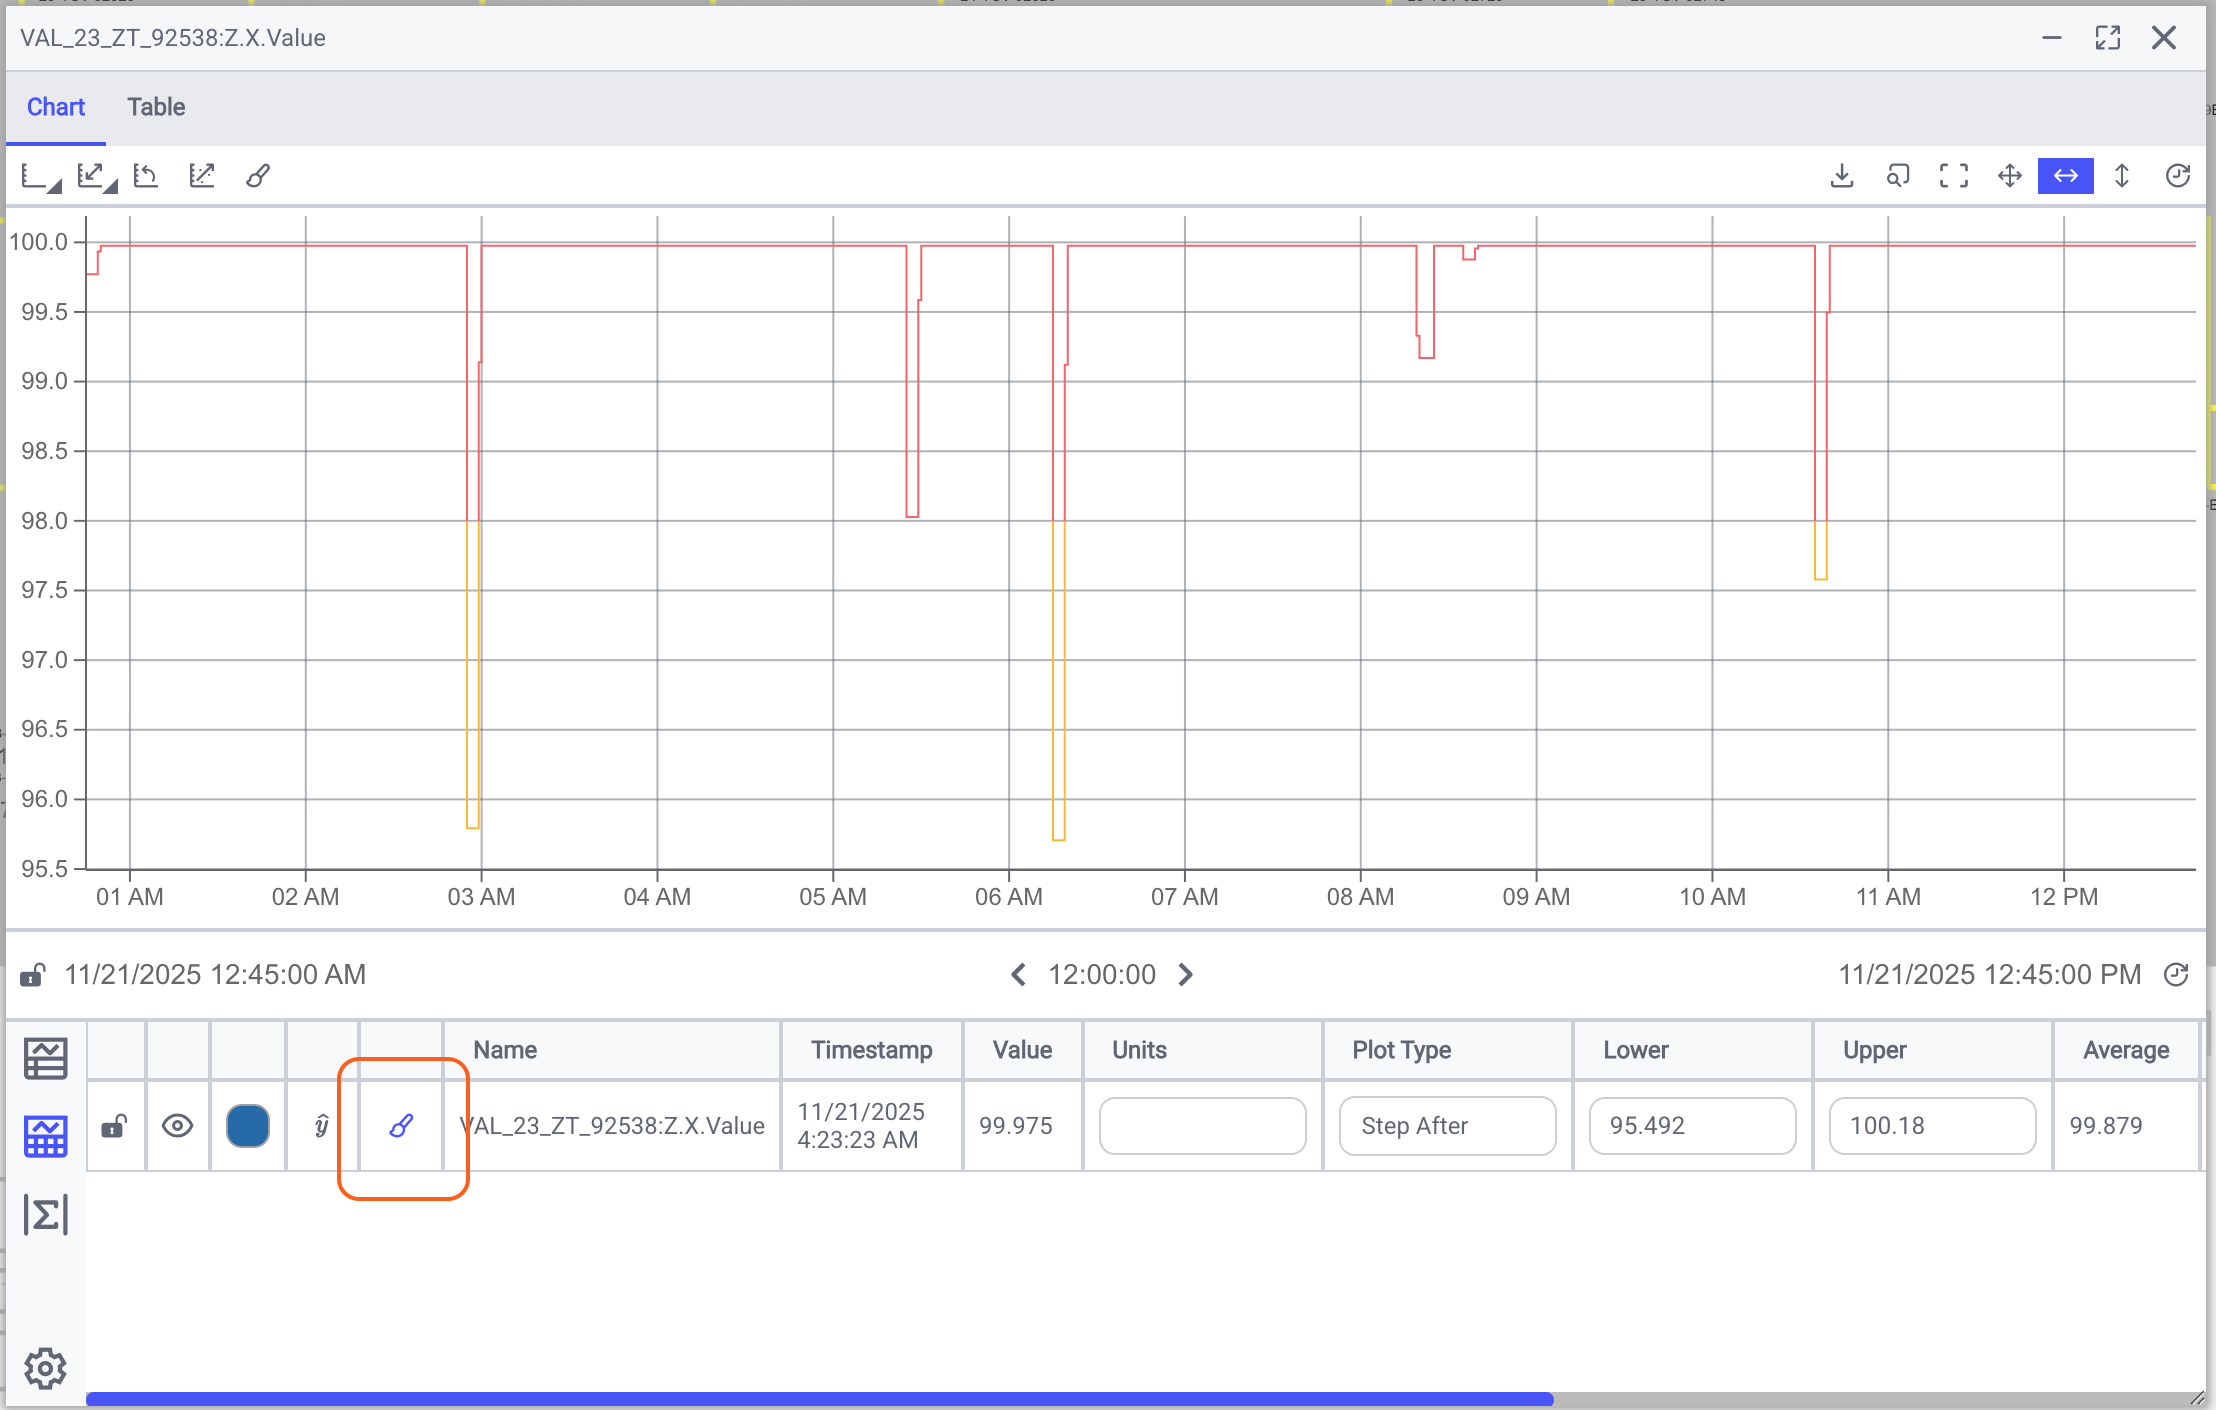
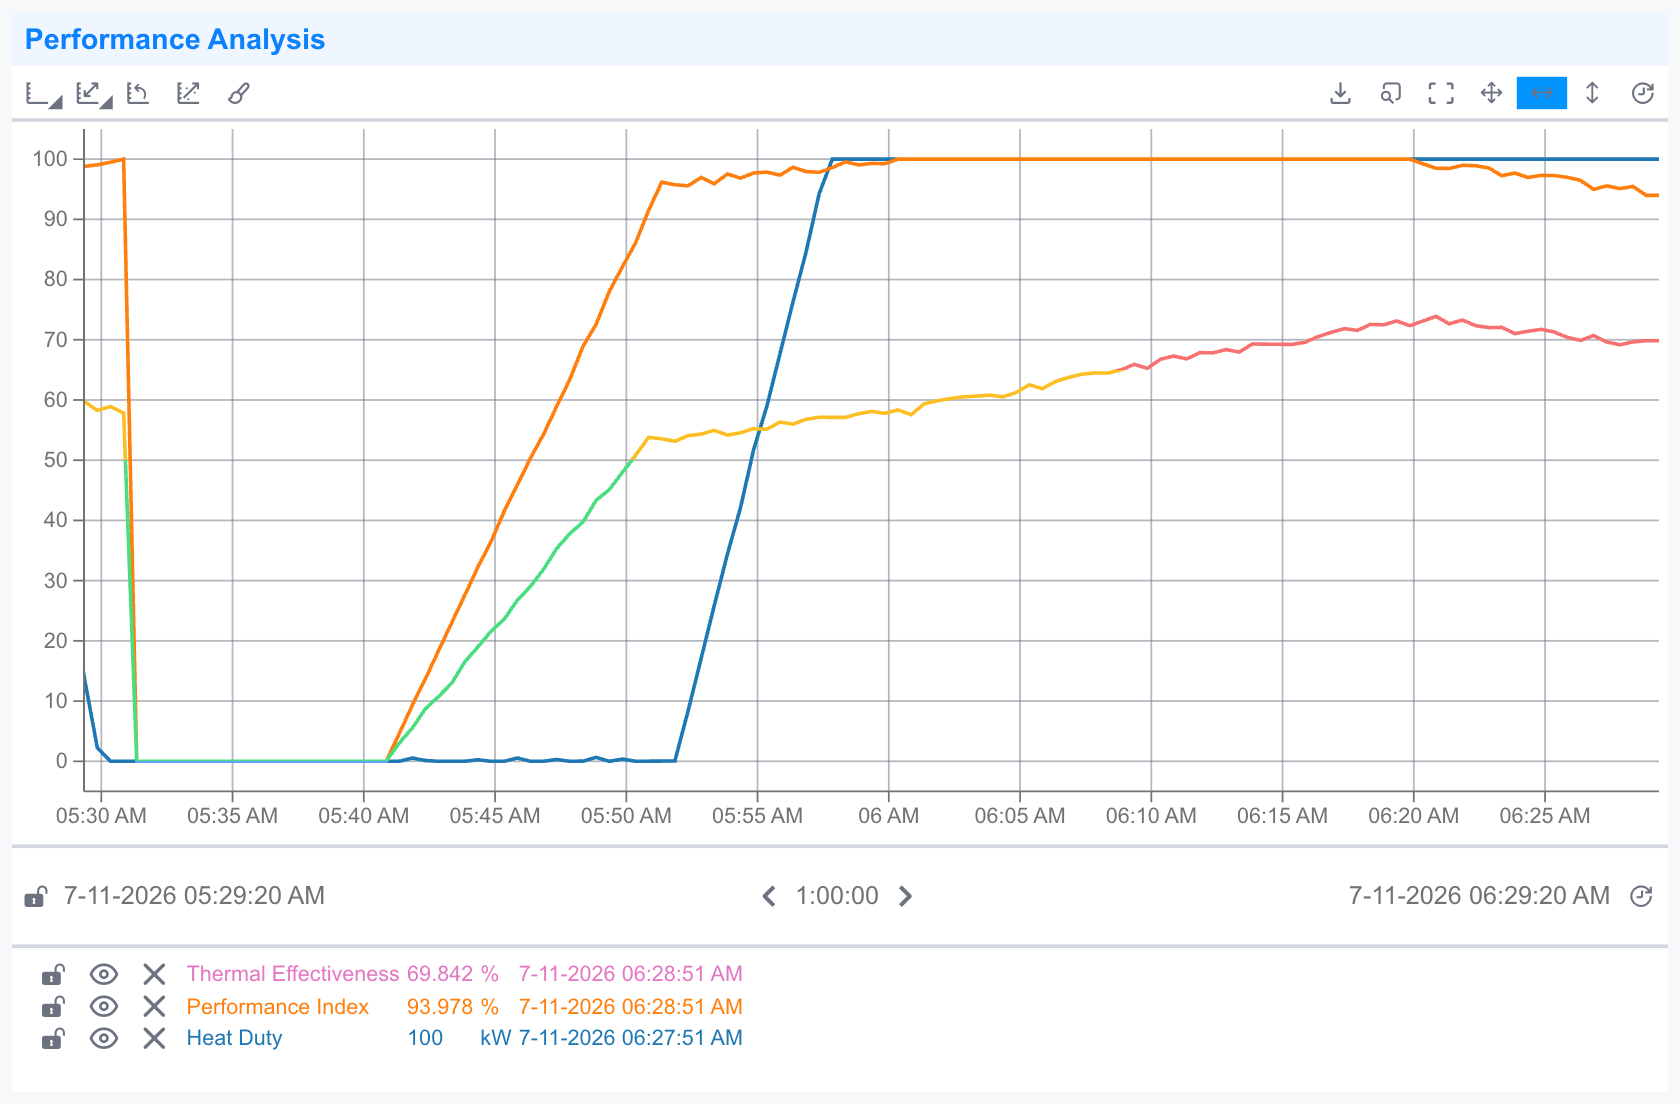
Use trace conditional formatting to recolor a trace where it crosses a threshold (for example, orange above one limit and red above another), so out-of-spec periods stand out.
Open it from the trace format icon, which appears in two places: in the toolbar (top-left), which shows the formatting for all traces; and next to each trace in the table legend, which opens the dialog pre-filtered to that channel.
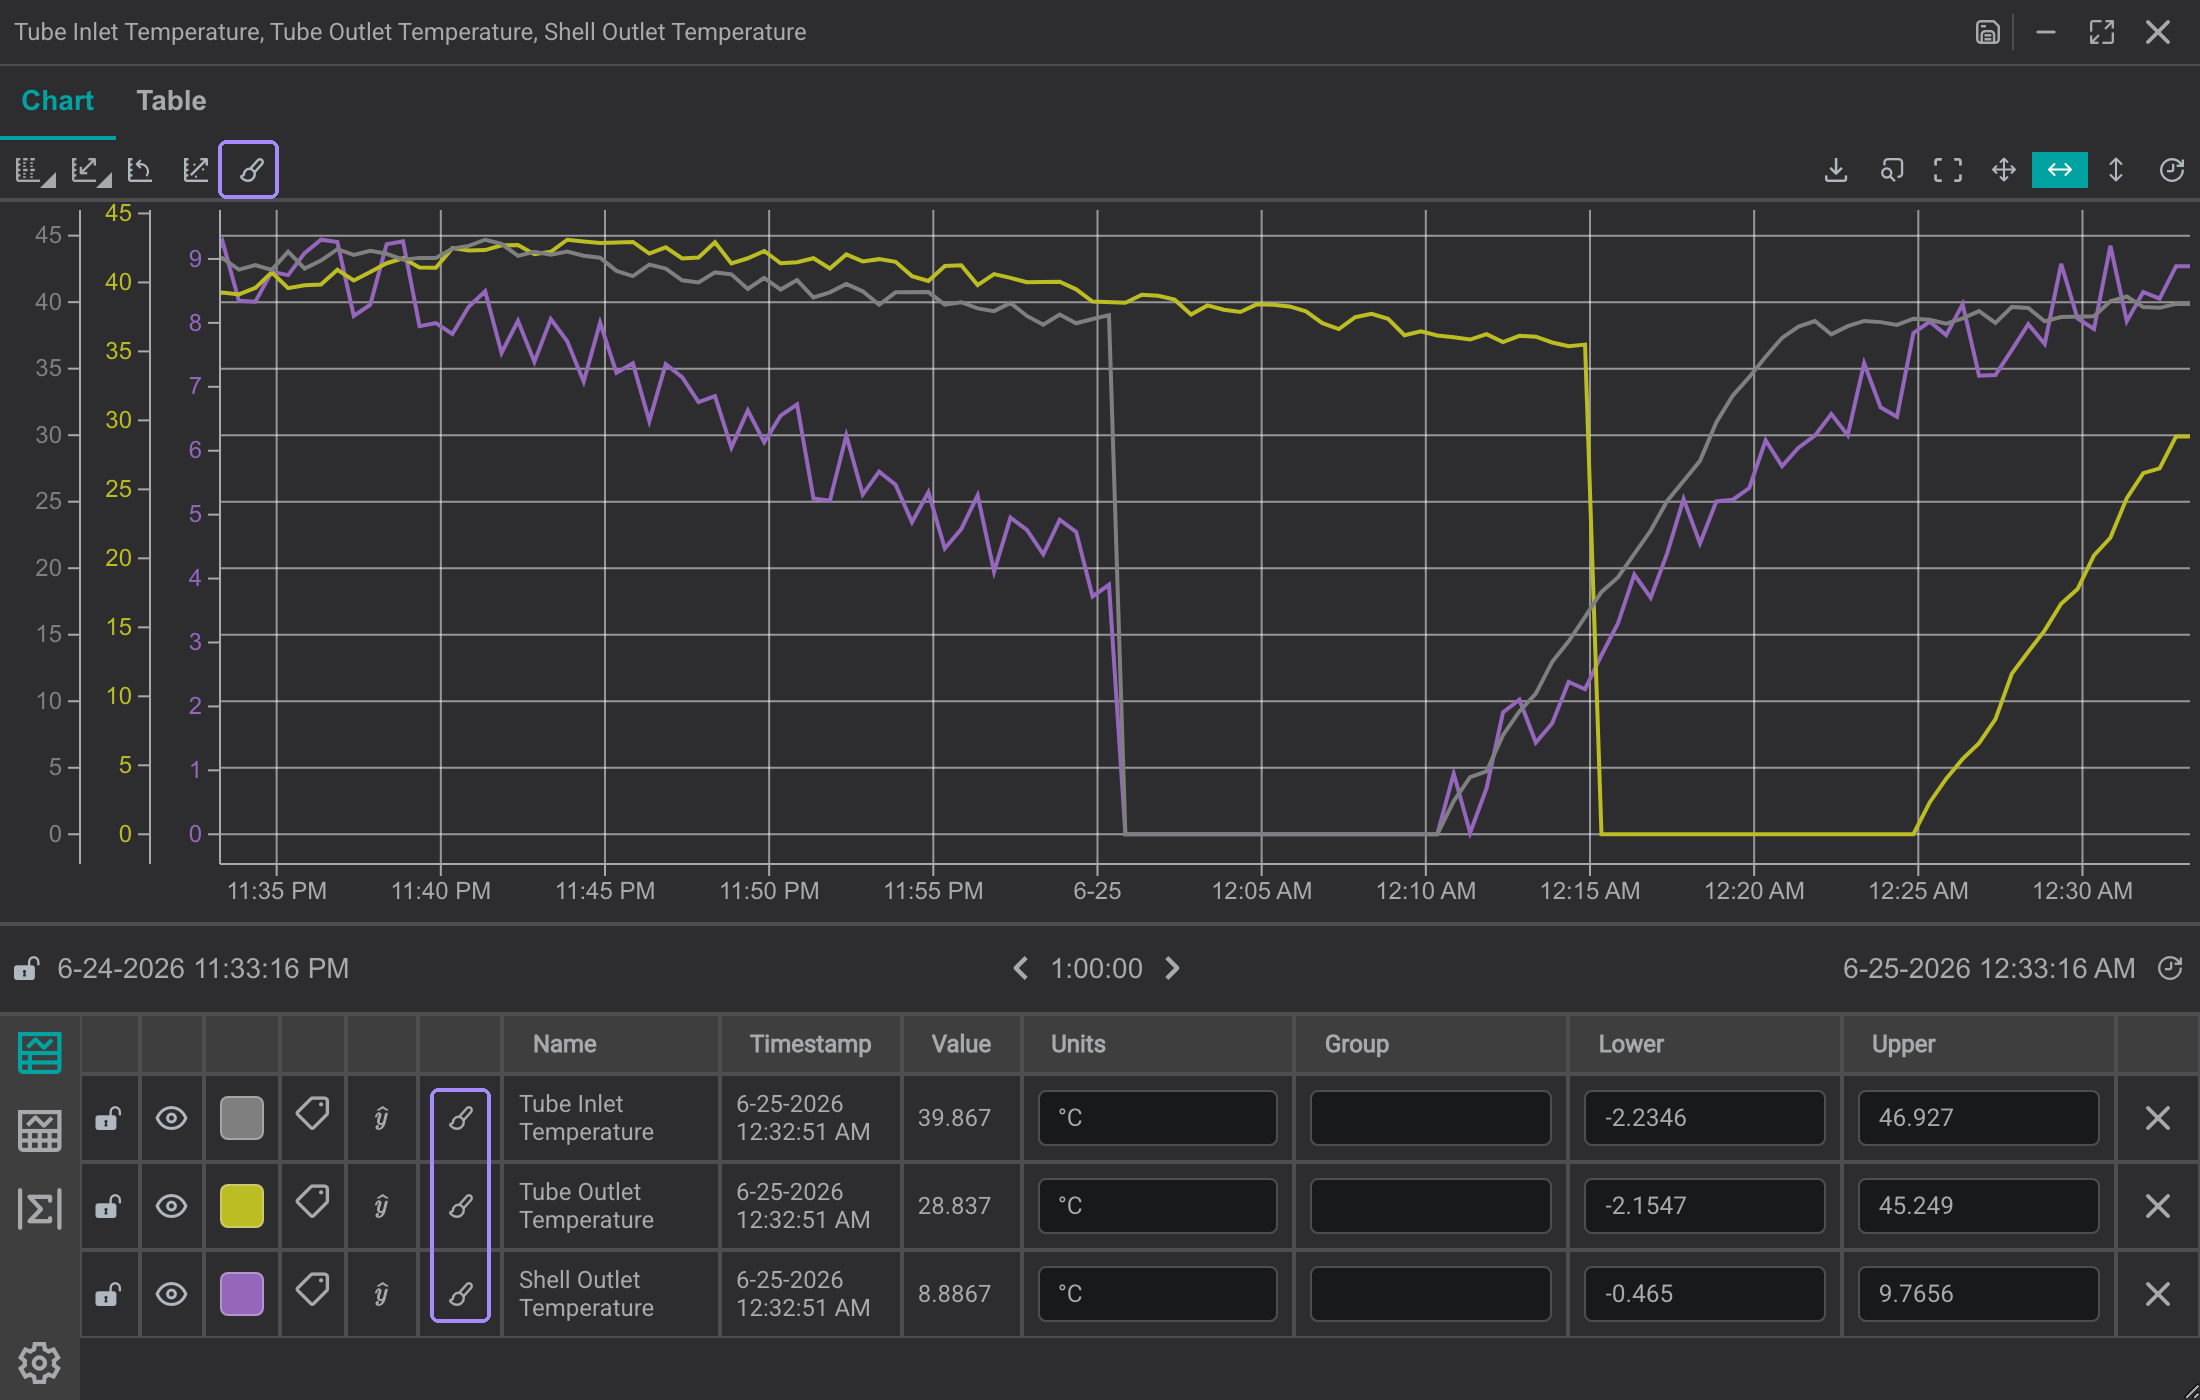
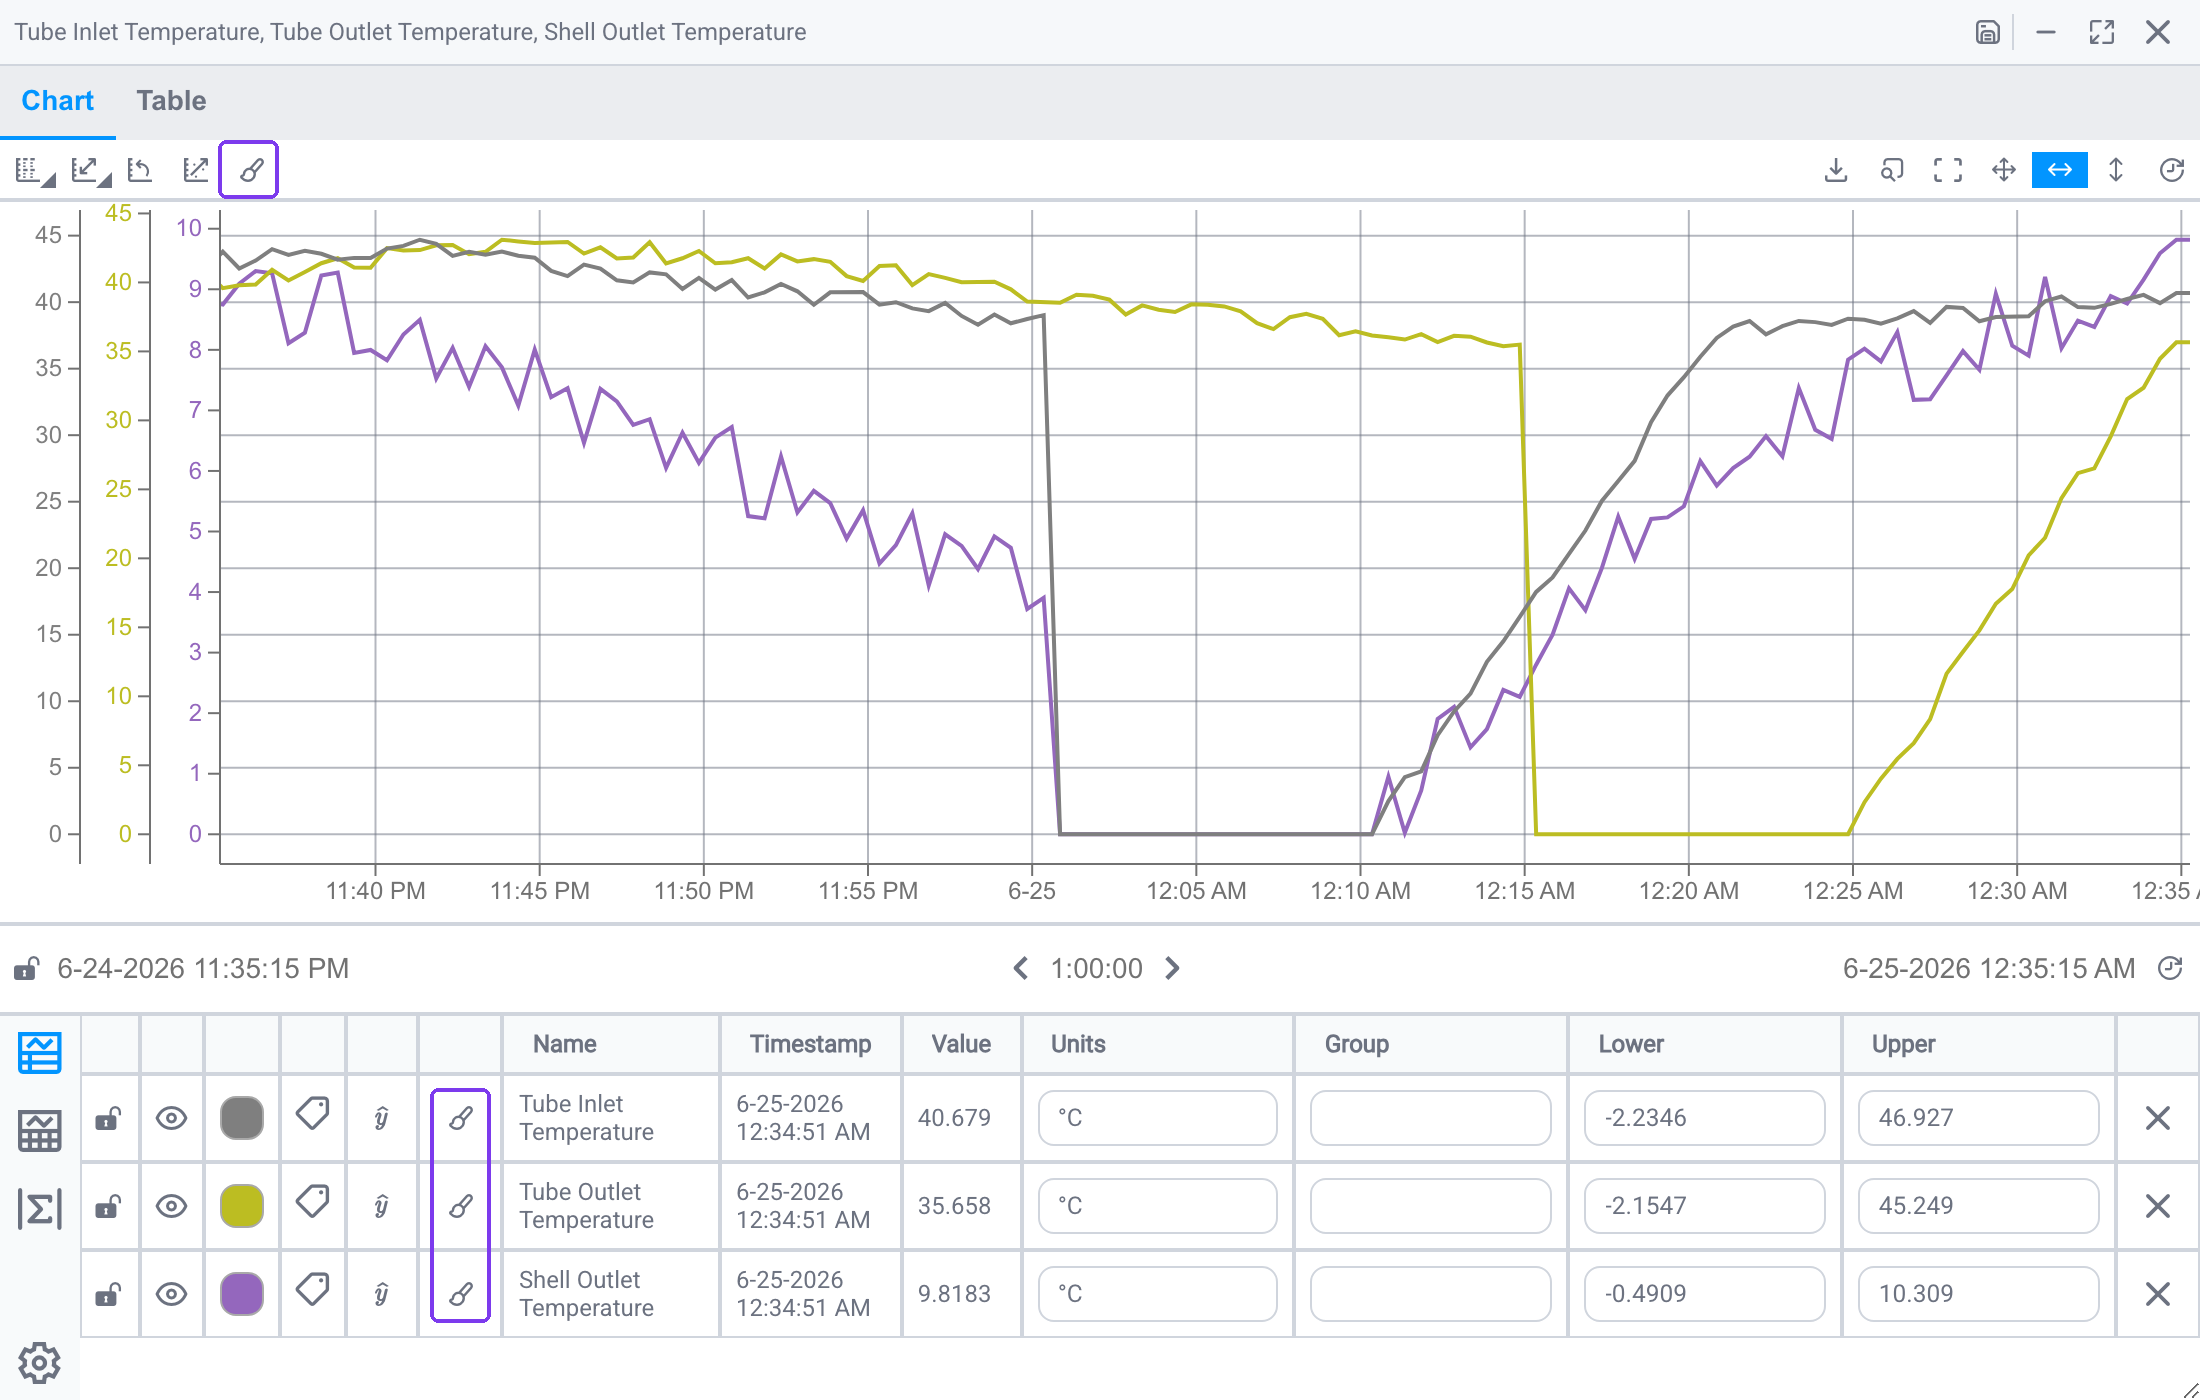
To add a condition, choose a Channel, optionally pick a Preset Trace Format, then click +.
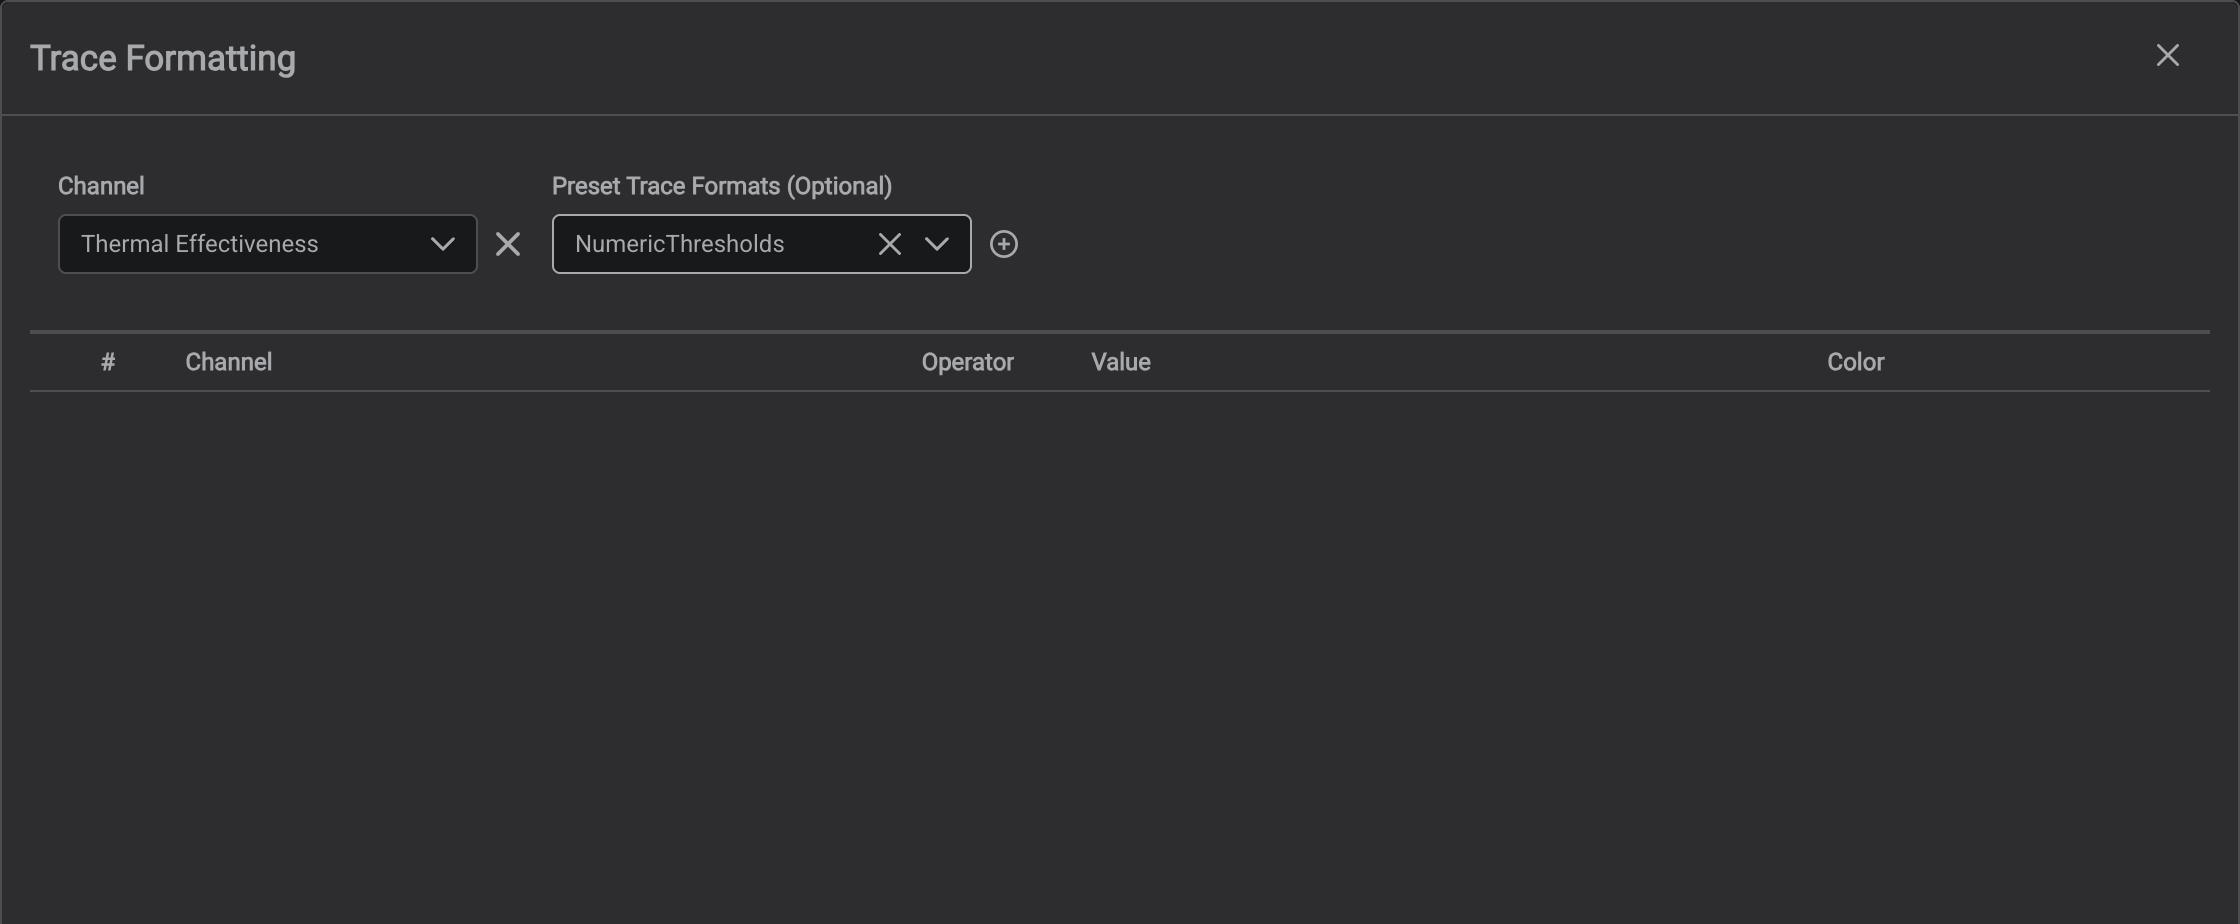
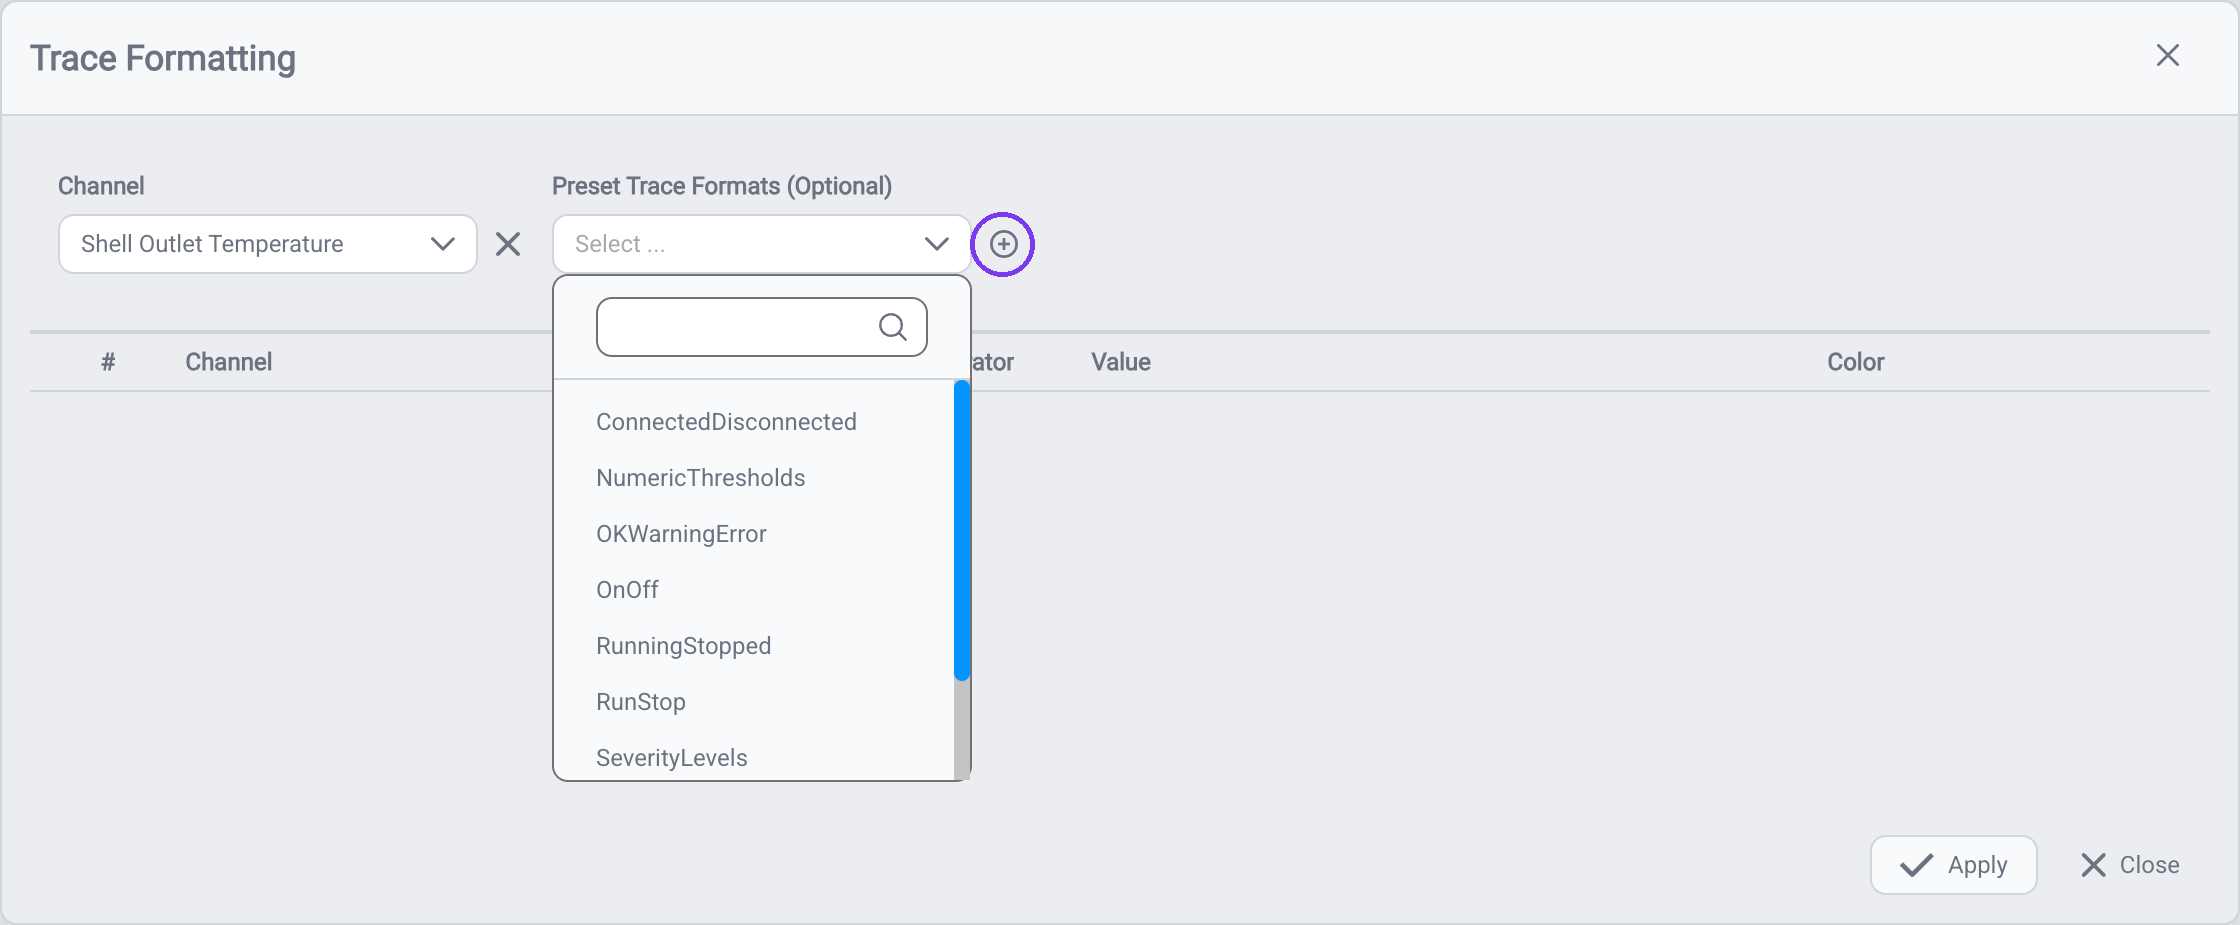
If you pick a Preset, IOTA pulls that preset's formats from the active theme and adds them as rows automatically: several rows if the preset defines multiple states. You can then fine-tune the Operator, Value, and Color of any row.
Tips
Presets come from the active theme. The built-in themes include a standard set of presets, but a custom theme created before presets were introduced may not have any, in that case an administrator can add presets to the theme.
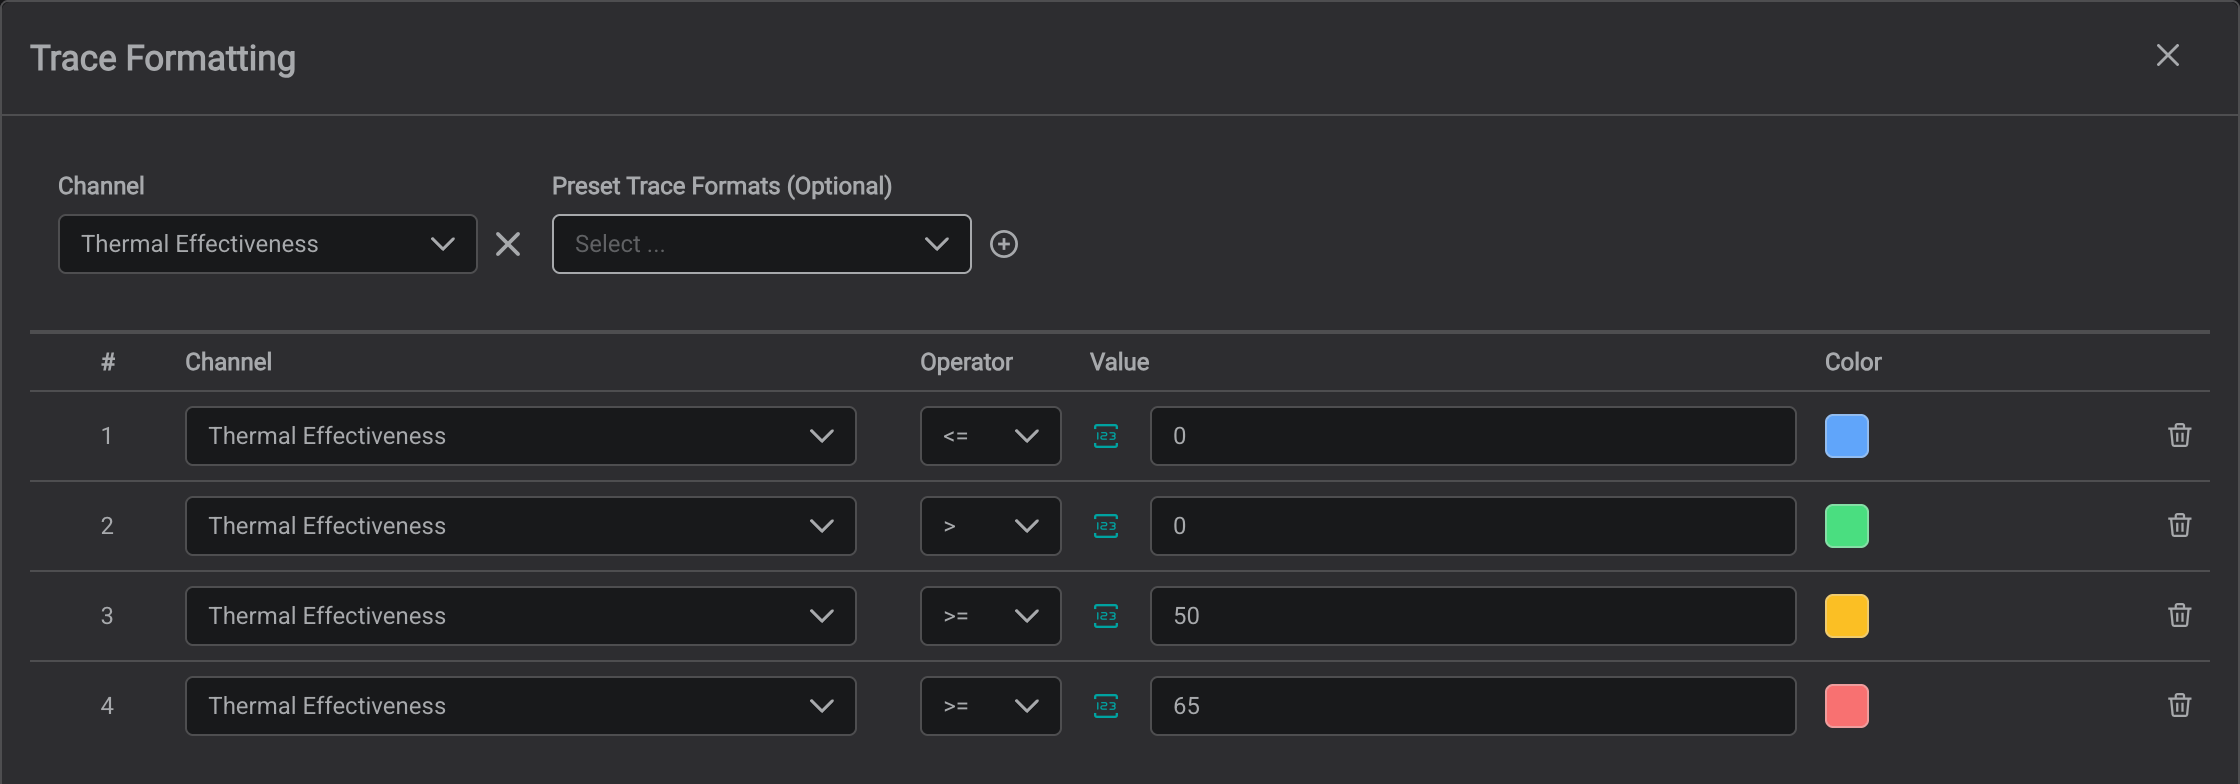
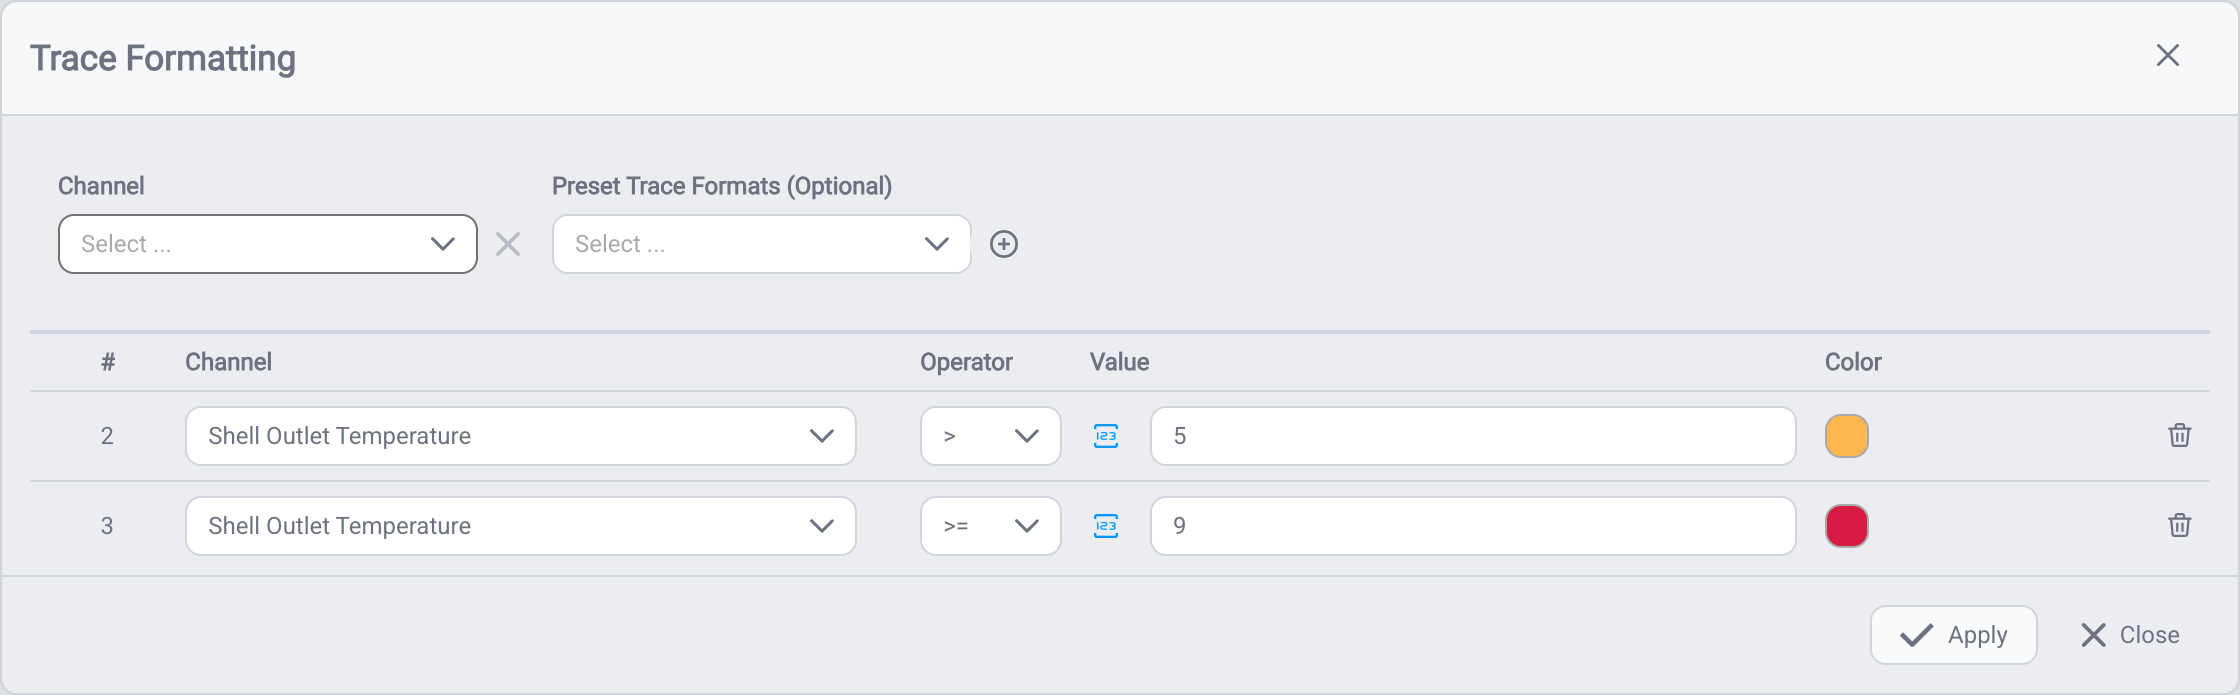
Click Apply. The trace then changes color wherever a condition is met, making out-of-spec areas easy to spot at a glance.
Fit a Regression Line
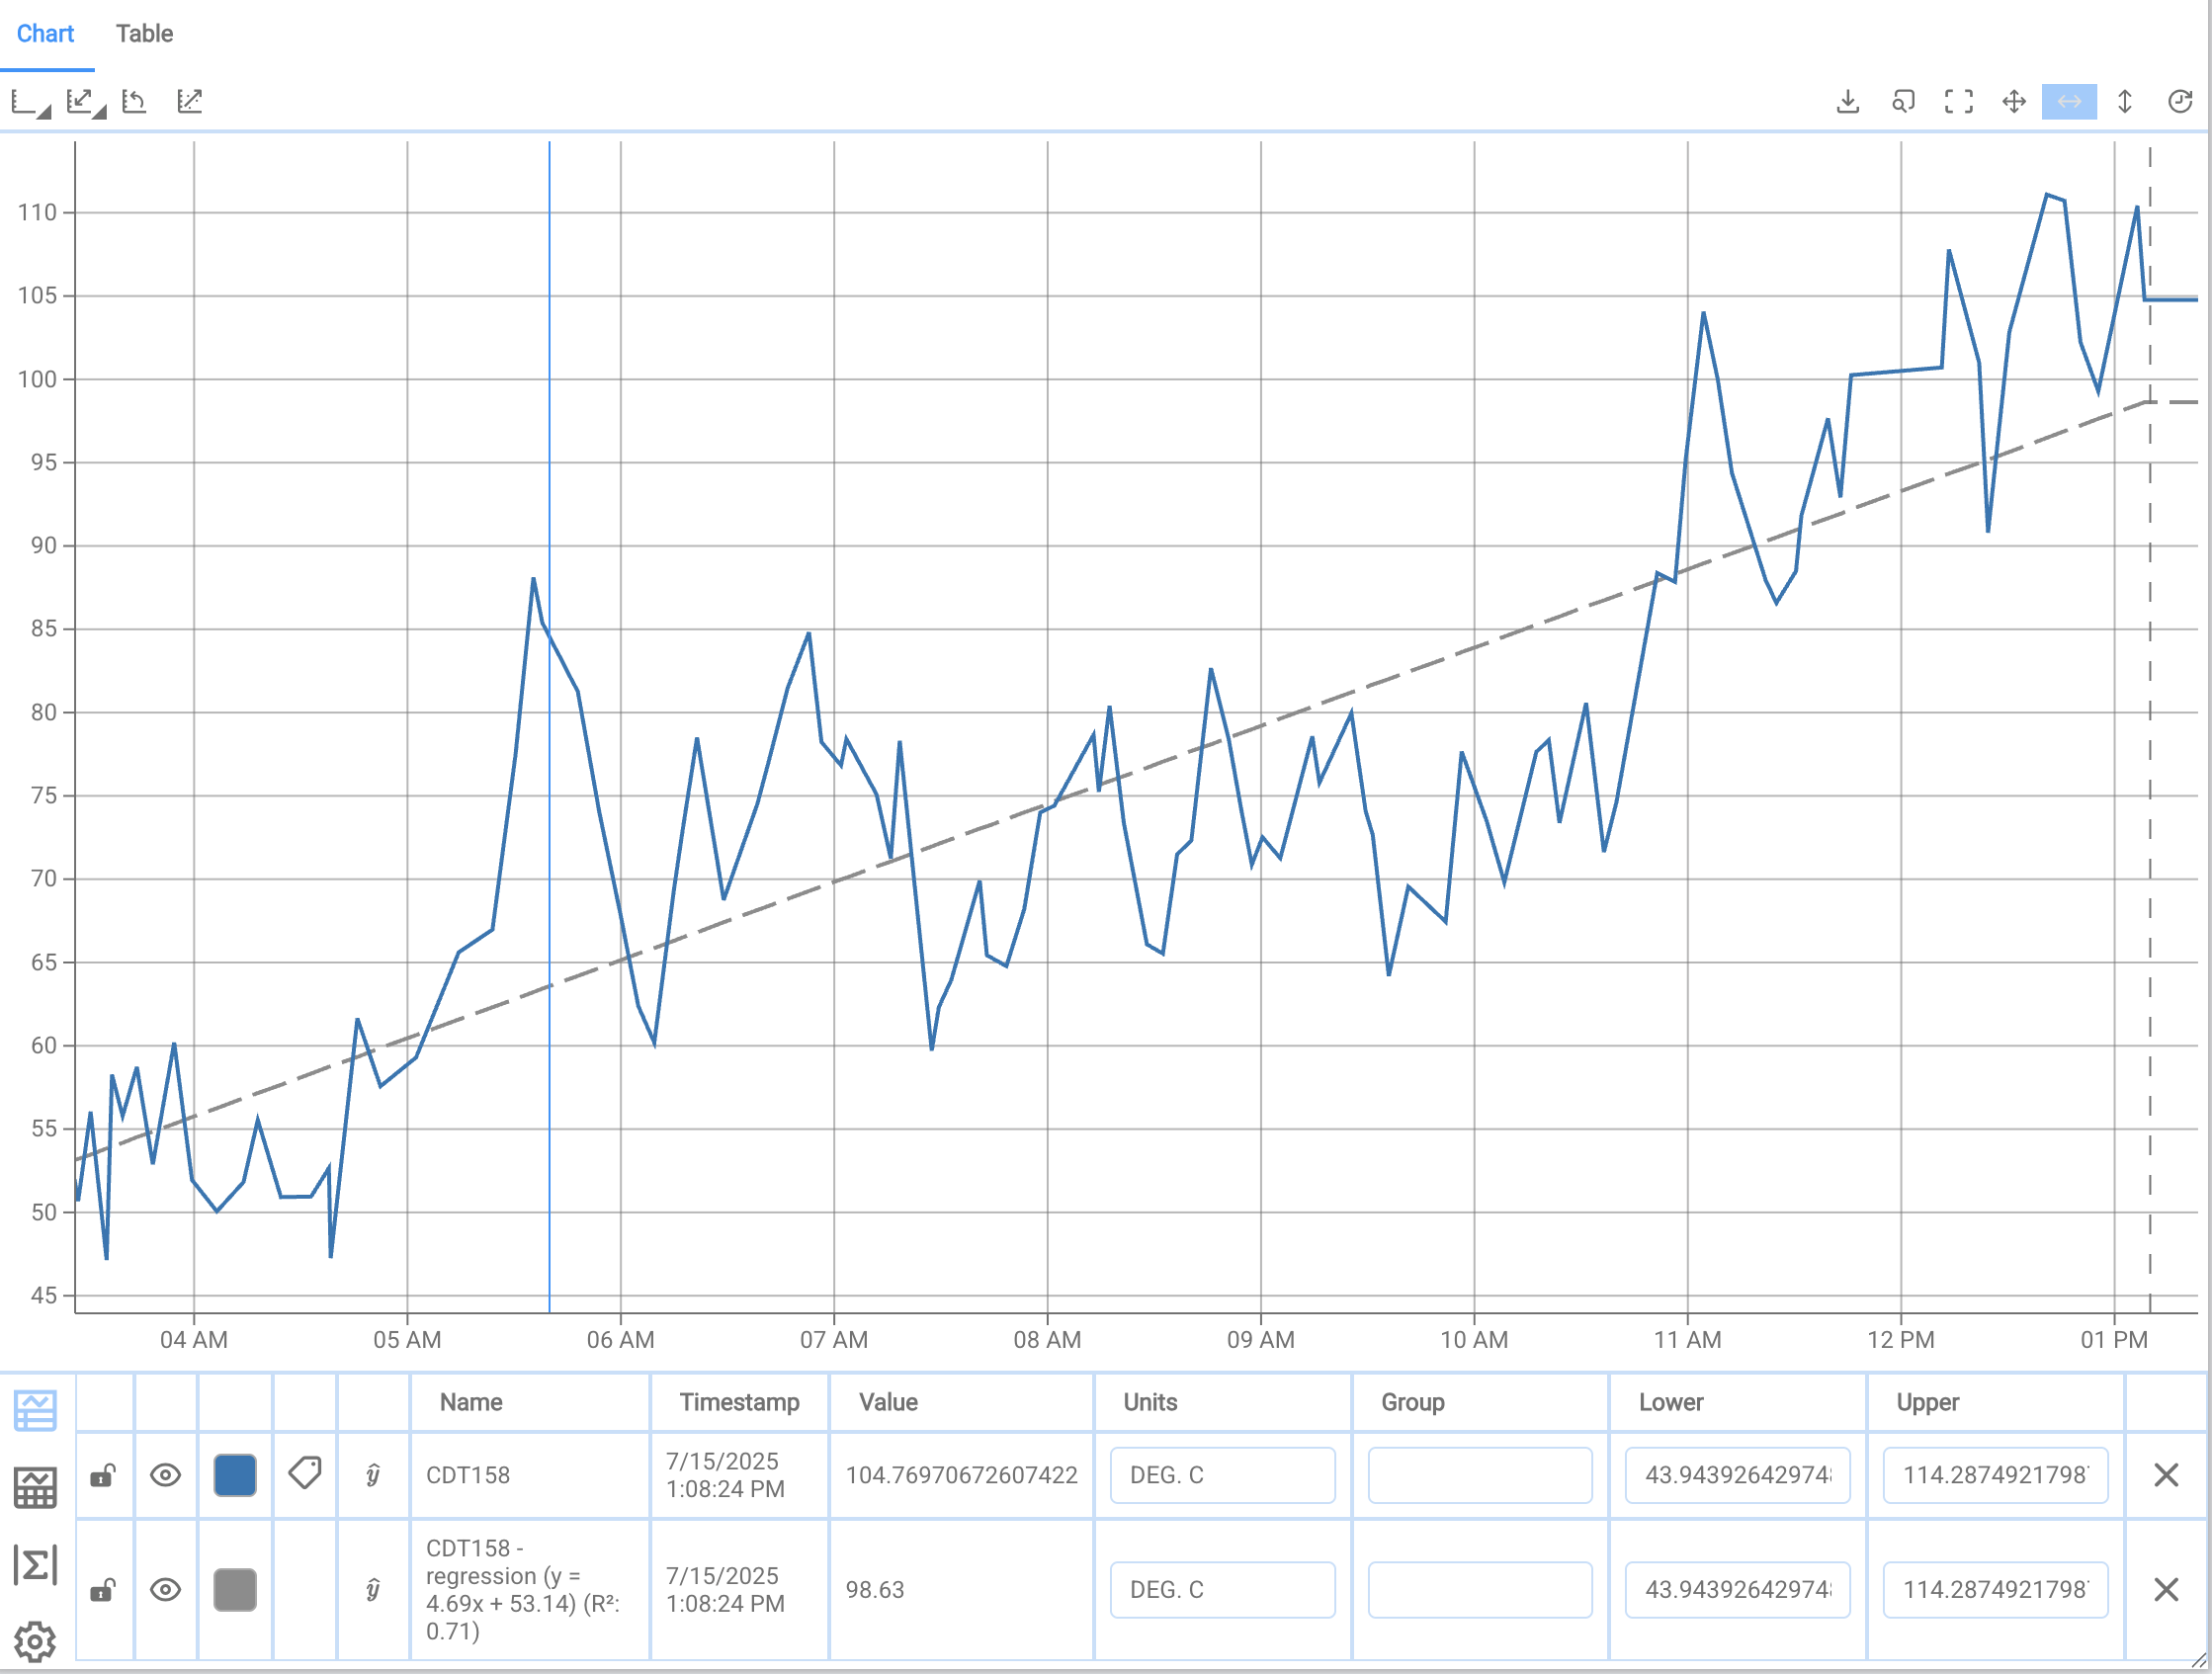
Overlay a calculated regression line to reveal the underlying trend, correlation, or rate of change in a signal: useful for spotting drift or projecting where a value is heading. IOTA computes the regression, so the data source doesn't need to support it.
To add one, open Regressions Configuration (the ŷ icon on a trace in the legend, or the regressions control in the toolbar), pick the source channel, click +, and choose a Regression Type: Linear, Exponential, Logarithmic, Power, Polynomial, Min, Max, or a Custom formula. You can also set the line's color, thickness, and style, and optionally show the equation and R² value.
Add a Static Limit Line
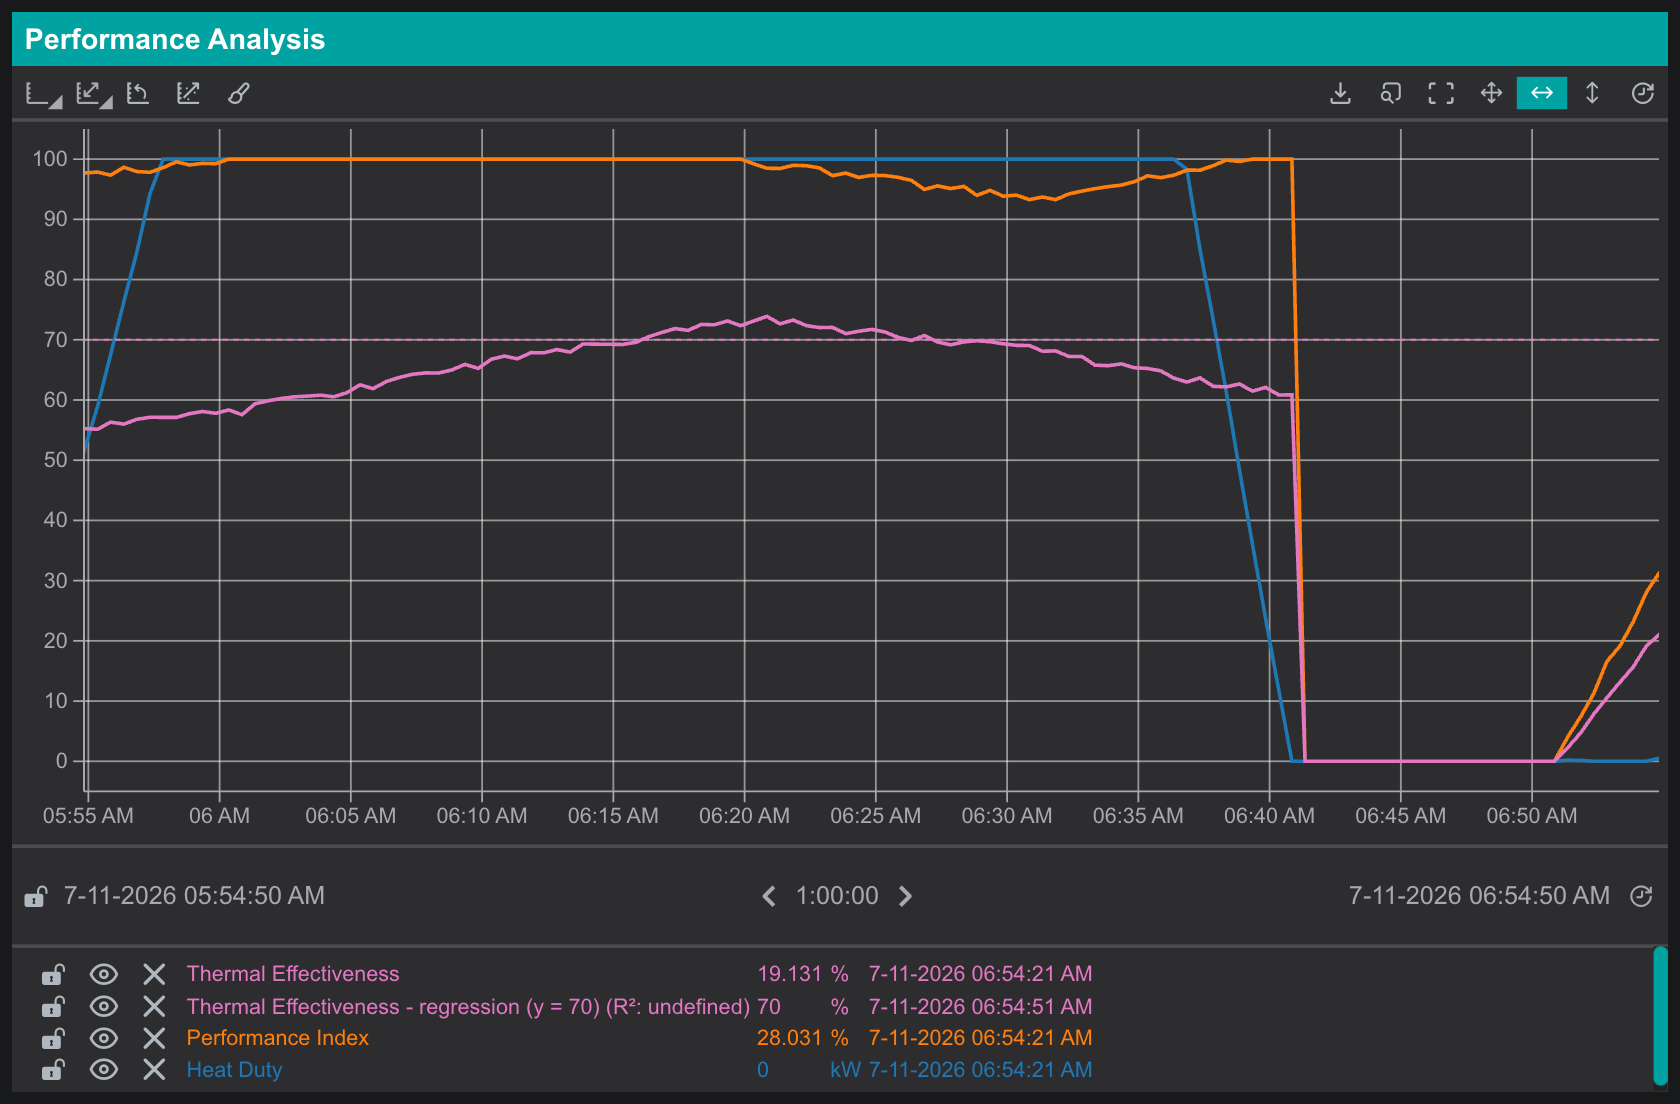
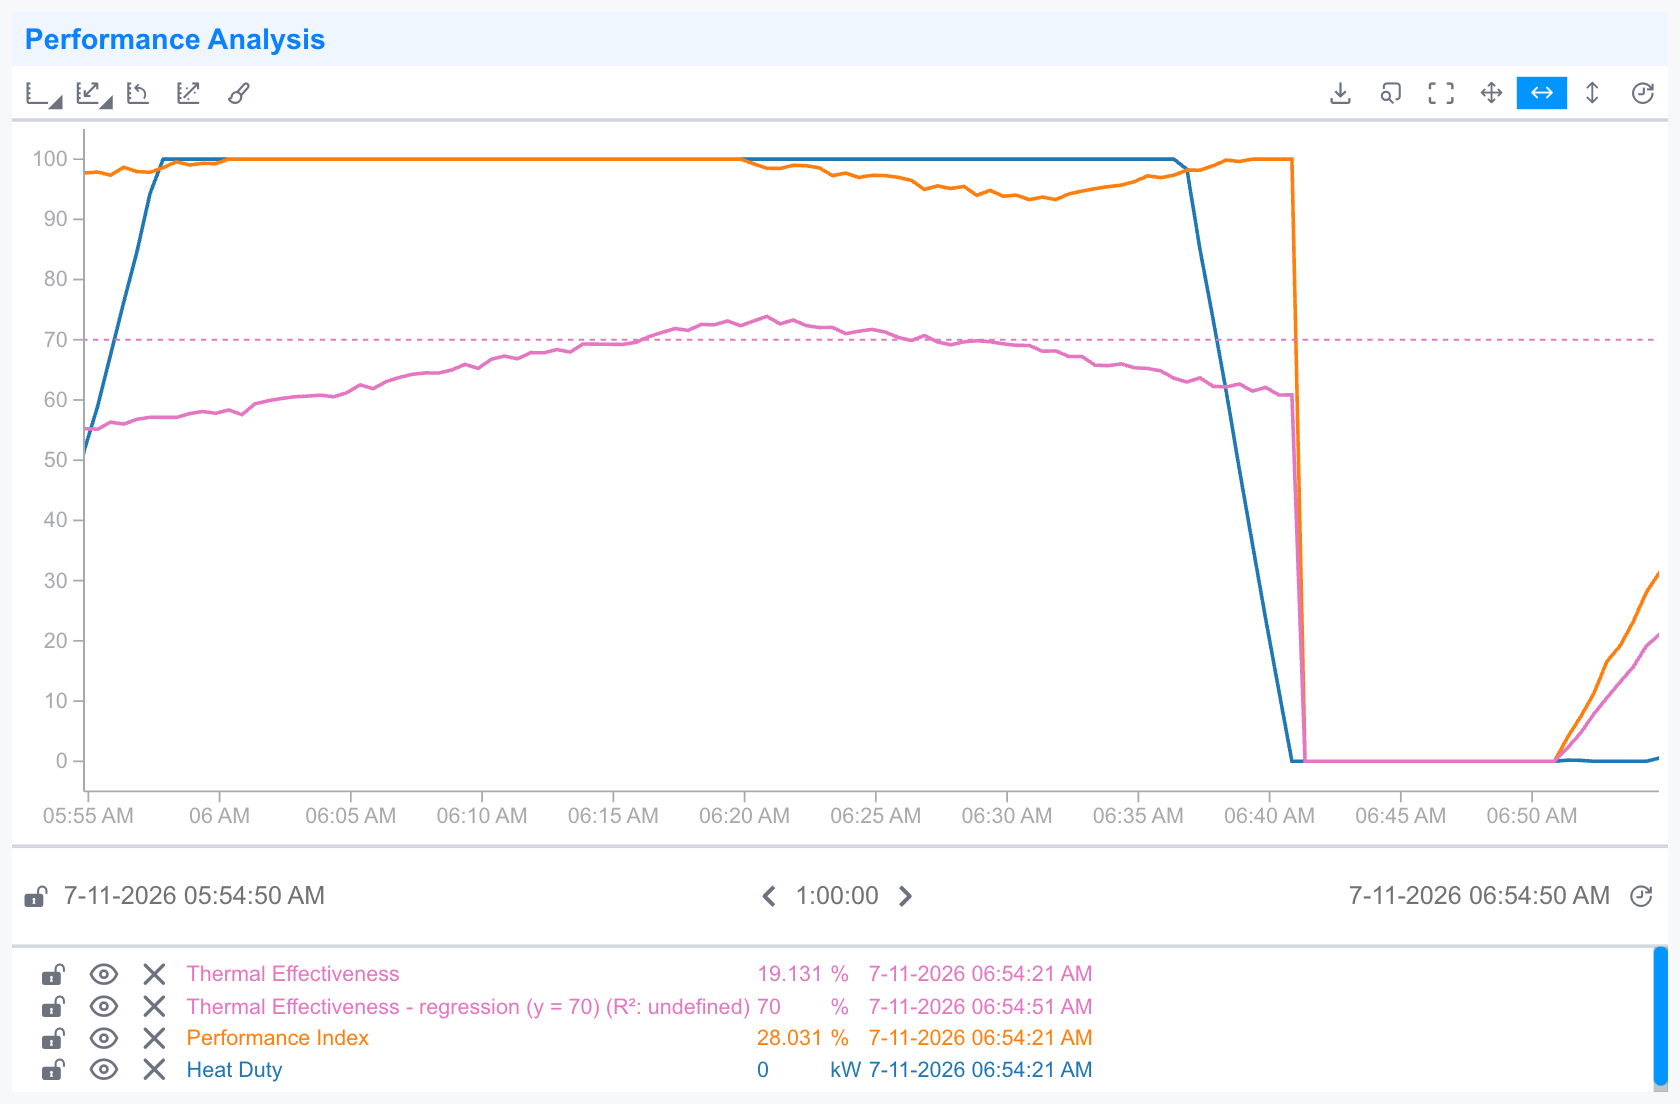
To draw a fixed reference line (a spec limit, alarm threshold, or target), add a regression and set its type to a constant value (for example a Custom formula such as y = 80, or Min/Max). The line stays flat at that value across the whole time range, making it easy to see when a trace crosses it.
Tips
For a full reference on the ad hoc trend tool, see Trending Data. To save and share trends, see Saving Ad Hoc Trends and Sharing Ad Hoc Trends.
What's Next
When a trend is worth keeping, continue to Saving Ad Hoc Trends to return to it later or share it with a colleague.
Related
- Saving Ad Hoc Trends: keep a trend for later
- Customizing a Trend: style traces and scales
- Data Export: export the underlying data to CSV