
Data Export
Data Export
You can export data from IOTA Vue to CSV for offline analysis or reporting in a spreadsheet application such as Microsoft Excel or Google Sheets.
Which components can export
Some components let you export their data directly using a download button. Whether the button is available depends on how the person who built the display configured the component.
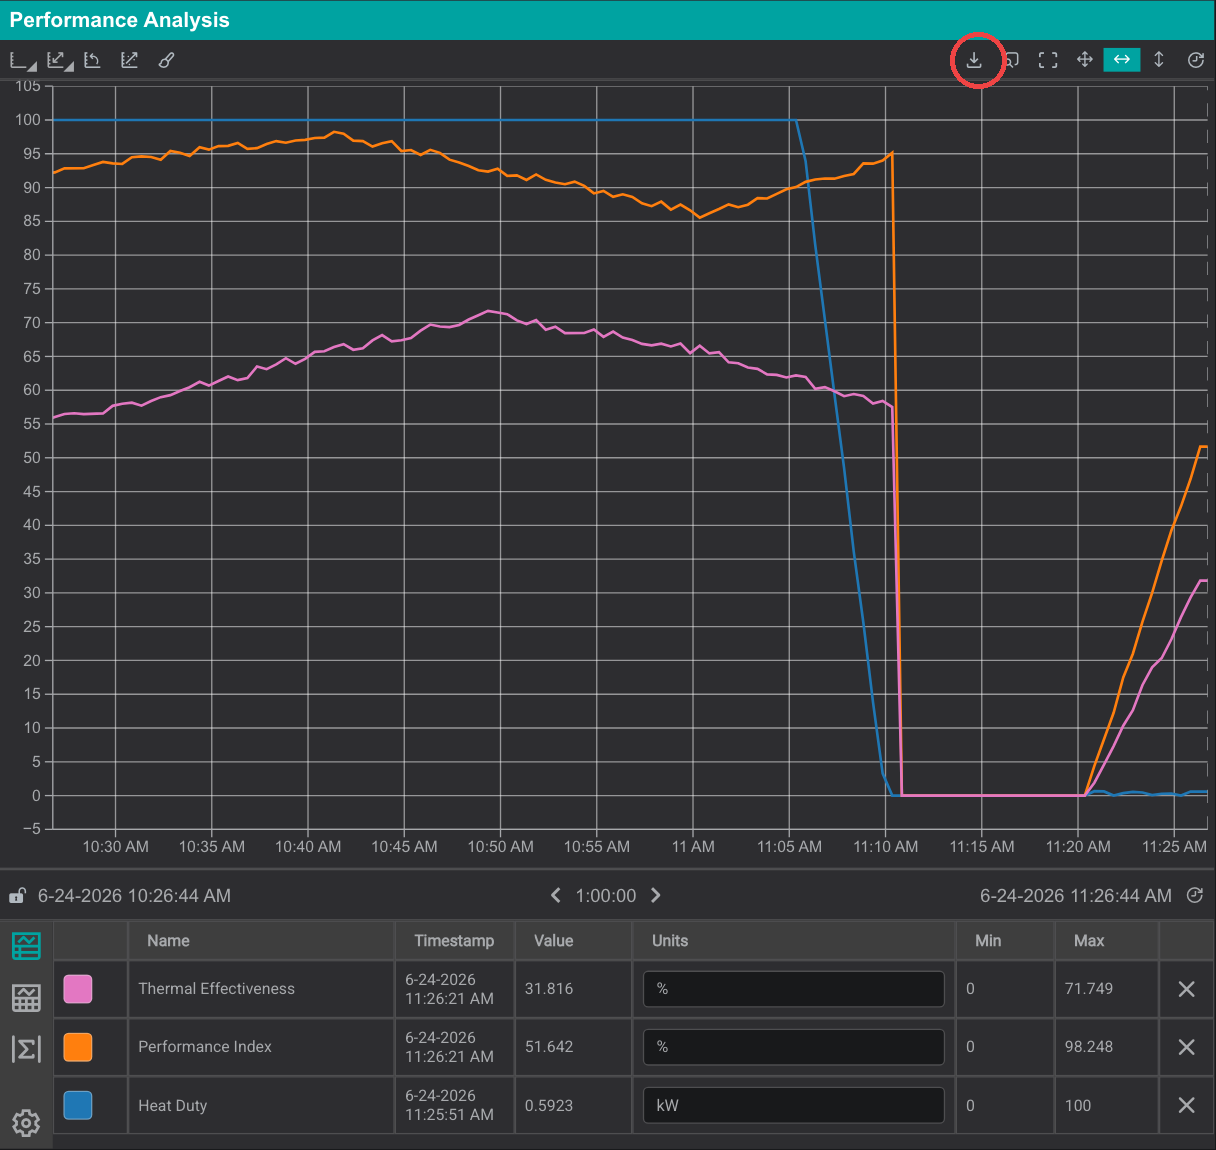
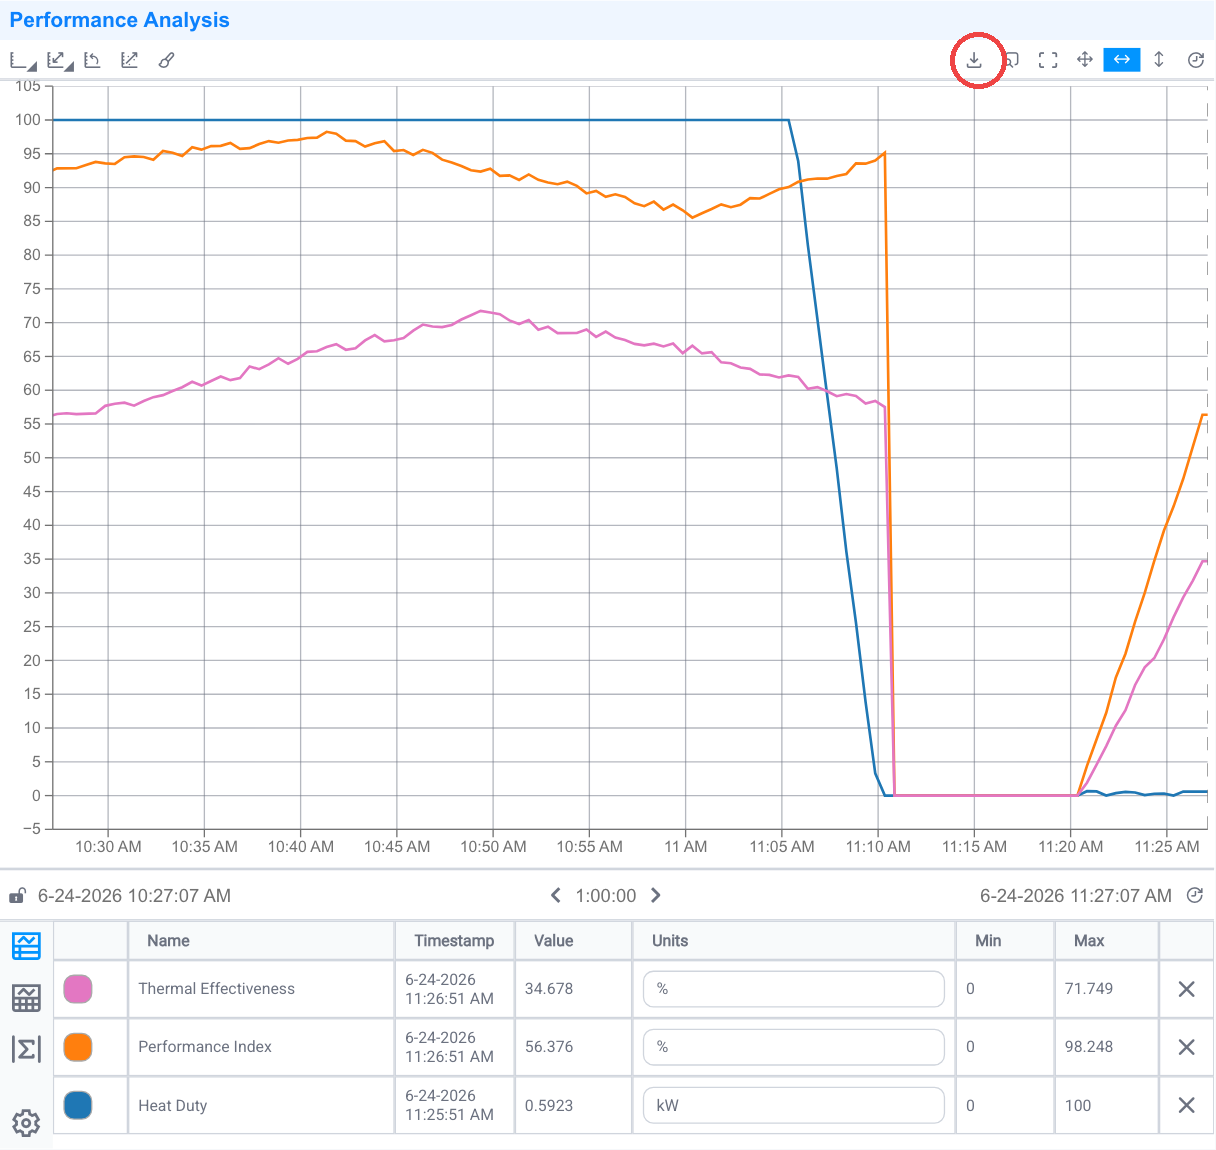
- Line Chart: when the chart's on-chart controls are enabled, a download icon appears in the chart's top-right toolbar. Use it to export every signal currently on the chart.
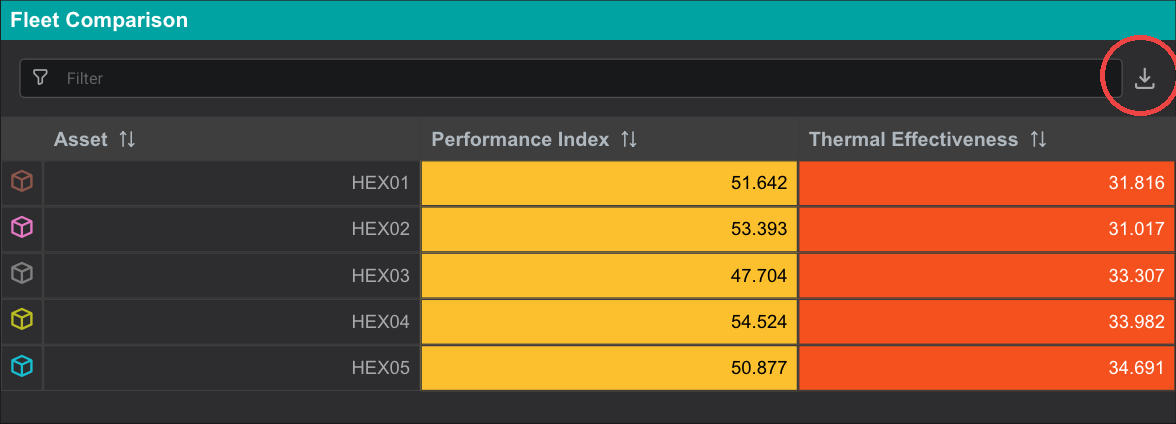
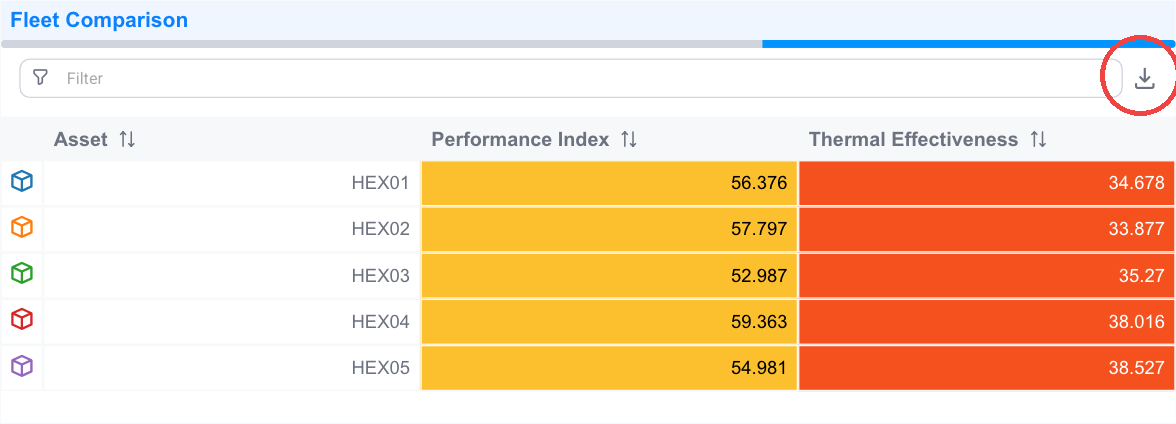
- Table: when the table's Global Filter is enabled, a download icon appears next to the filter box.
The ad hoc trend exports the same way, since it is a line chart with controls; open a trend, isolate the signals and time range you want, then use its download icon.
How the exported data is represented
The export is a CSV file structured as follows:
- The first column is named
xand holds the timestamp of each row, in your selected time format. - Each remaining column is one channel, with the channel's full path as the column header, for example
\\sandboxCS\Ad Hoc Demo\Heat Exchangers\HEX01|Thermal Effectiveness.
Each row is a single point in time. The export contains the raw values returned for each channel at that channel's own timestamps. It does not resample or interpolate the data onto a shared time grid, and it does not apply the chart's plot type (such as Step). Because different channels report at different times, a row often has a value for one channel and blank cells for the others. A blank cell means that channel had no value at that exact timestamp: it does not mean the value was zero.
What's Next
That completes the trending workflow. Next, personalize how IOTA Vue looks and behaves in User Profile & Preferences.
Related
- Analyzing a Trend: read exact values before exporting
- Saving Ad Hoc Trends: keep a trend for later
- User Profile & Preferences: personalize the Viewer