
Driver Logs
Driver Logs
The Driver Logs area of the Administration Page is a diagnostic record of activity from your data-source drivers. Use it to troubleshoot a connection that isn't returning data, confirm a driver is running, or review what a driver reported over a period of time.
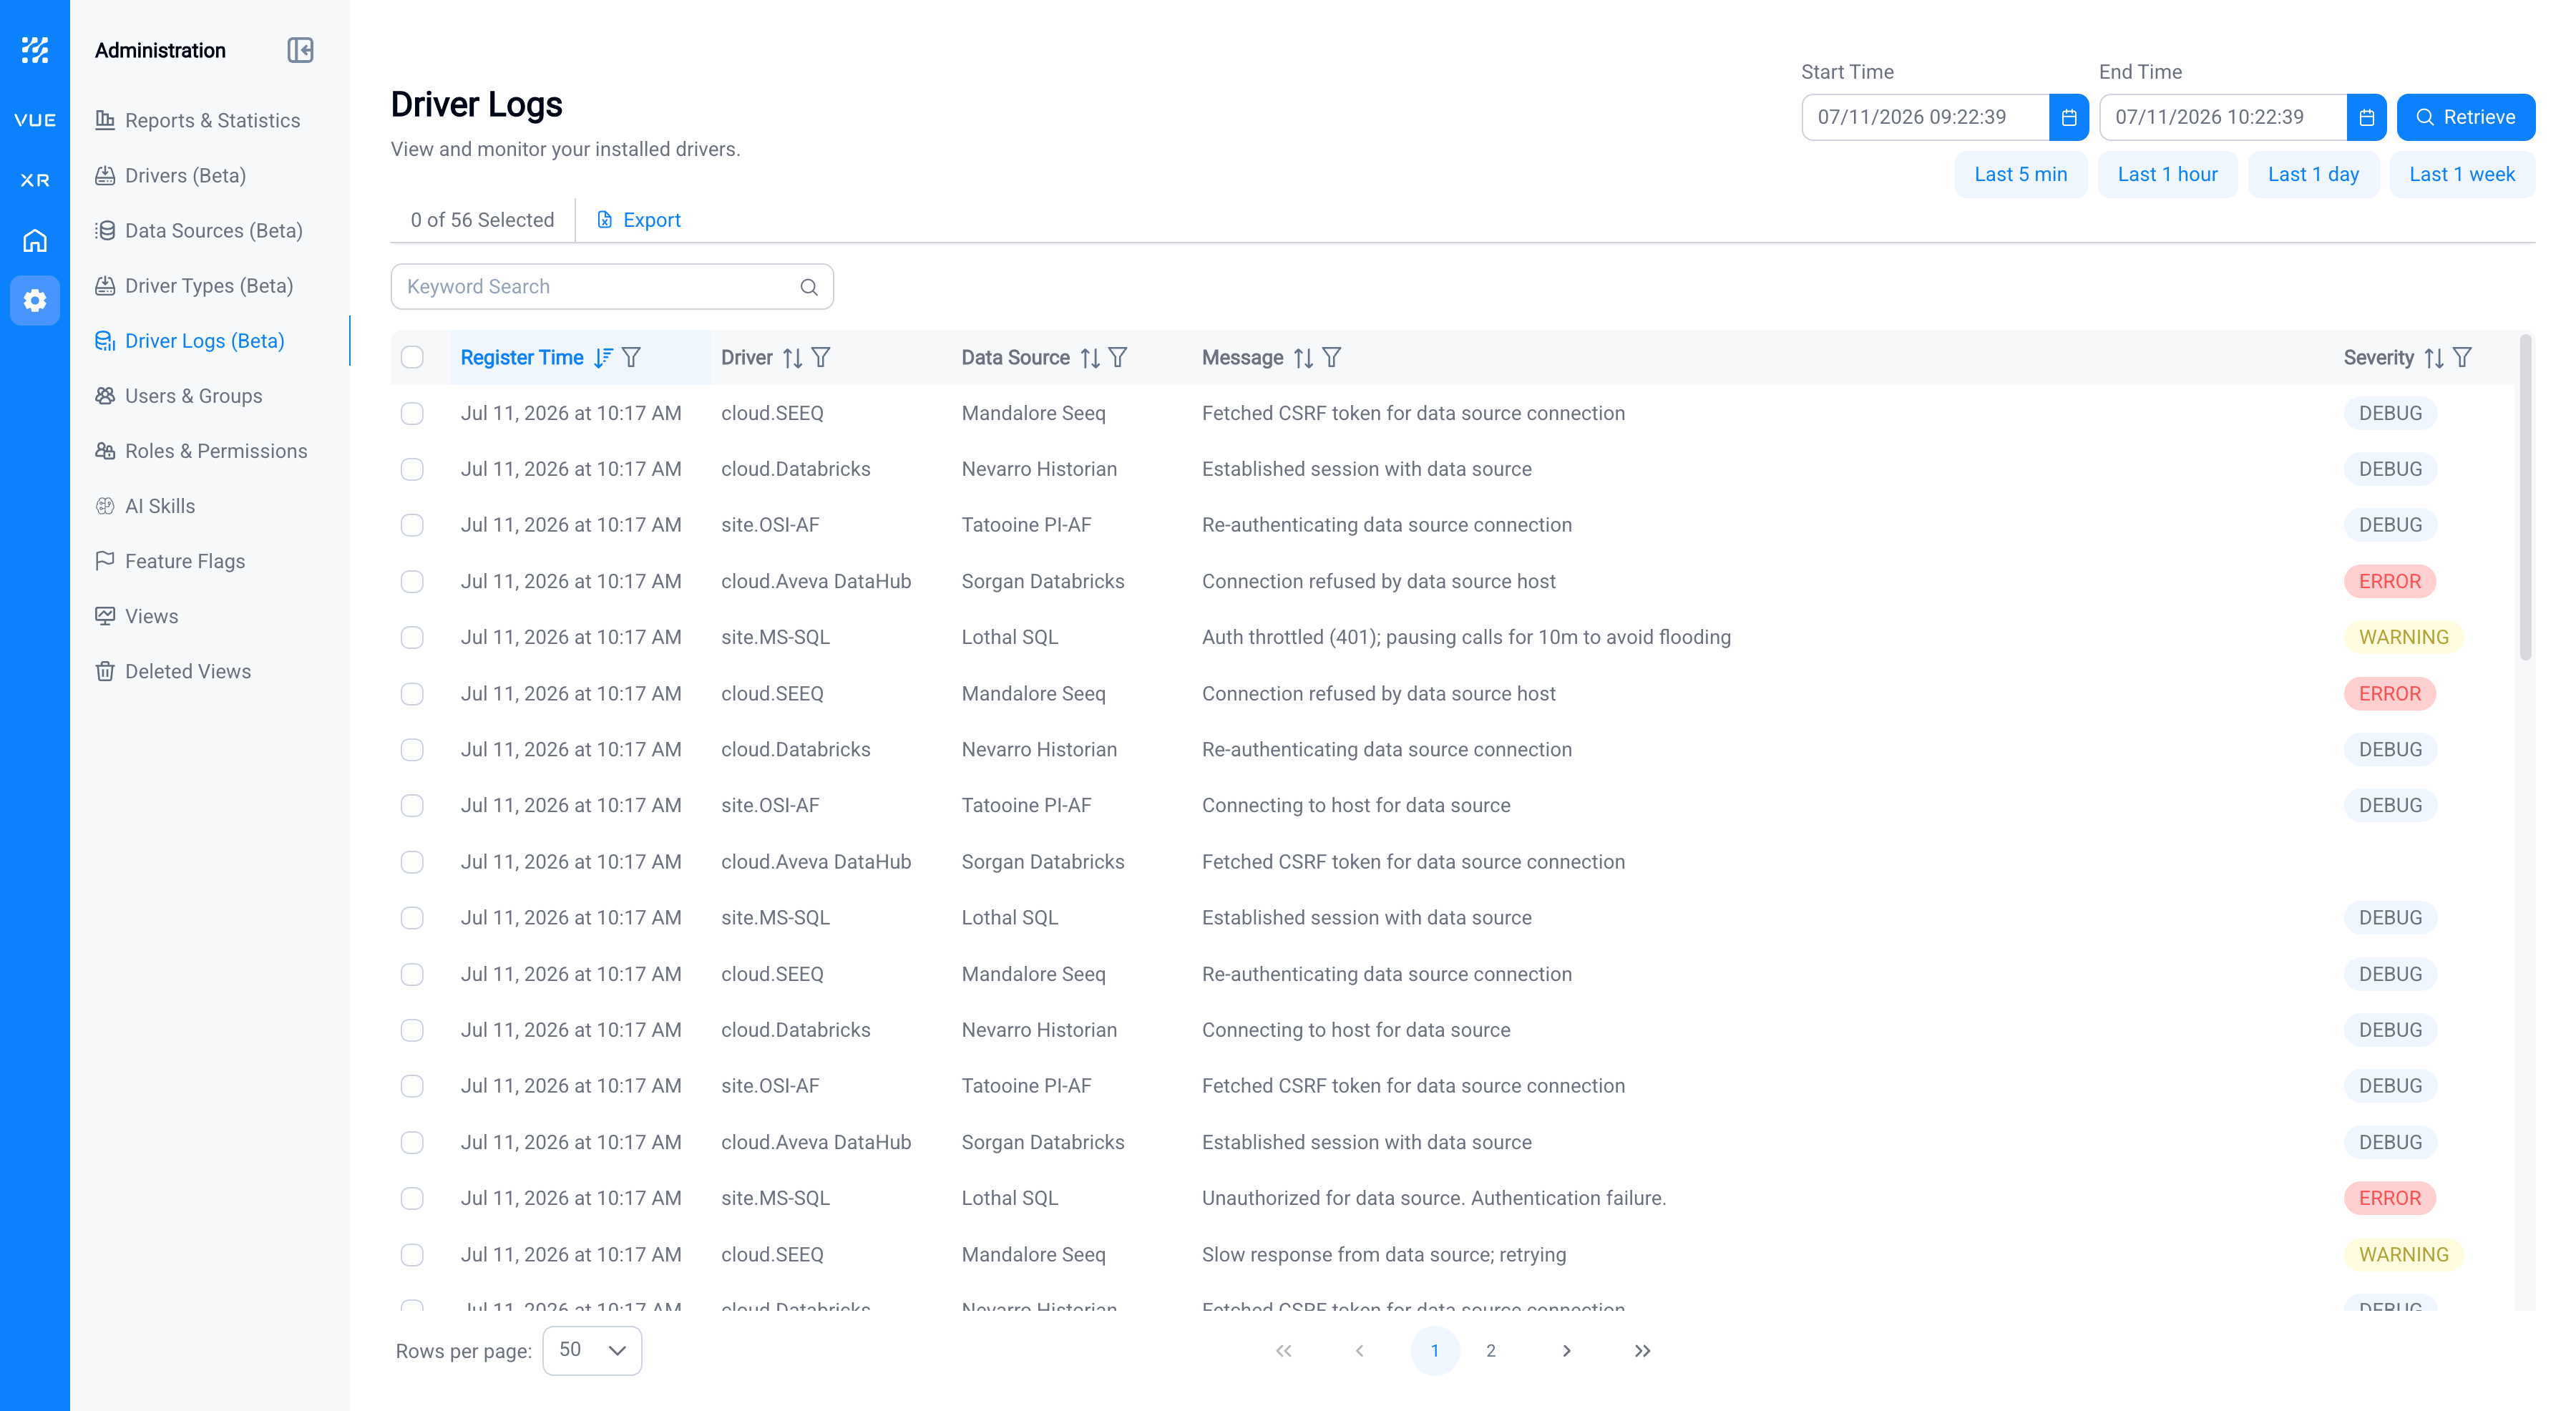
The log is a table with these columns:
| Column | What it shows |
|---|---|
| Register Time | When the entry was recorded. Logs are sorted newest first. |
| Driver | The driver that produced the entry. |
| Data Source | The data source (connection) the entry relates to. |
| Message | The diagnostic message itself. |
| Severity | The log level, color-coded: ERROR (red), WARNING (amber), and informational levels such as DEBUG. |
Choosing a time range
Driver Logs load for a specific time window. A time picker at the top of the page sets the Start Time and End Time; a recent window is preselected by default. Adjust the start and end, then click Retrieve to load the entries for that window. Quick presets (Last 5 min, Last 1 hour, Last 1 day, and Last 1 week), set the range and retrieve in a single click.
Logs do not refresh on their own: there is no live tail. To see newer entries, click Retrieve again or pick a preset.
Filtering and searching
Once entries are loaded, narrow them down without leaving the page:
- Driver, Data Source, and Severity; use each column's filter control to narrow to a specific driver, connection, or log level.
- Message: filter by typing text to match.
- Keyword Search: a single search box that matches across the visible columns.
Exporting
Use Export in the table's menu to download the current entries as a CSV file: useful for sharing with support or keeping a record while investigating an issue.
Logs for a single driver
To focus on one driver, open Drivers in the Administration Page, click the driver to open its detail view, and select the Logs tab. This per-driver view works like the main Driver Logs page: the same columns (including color-coded severity), time range, quick presets, filtering, and keyword search, but scoped to just this driver.
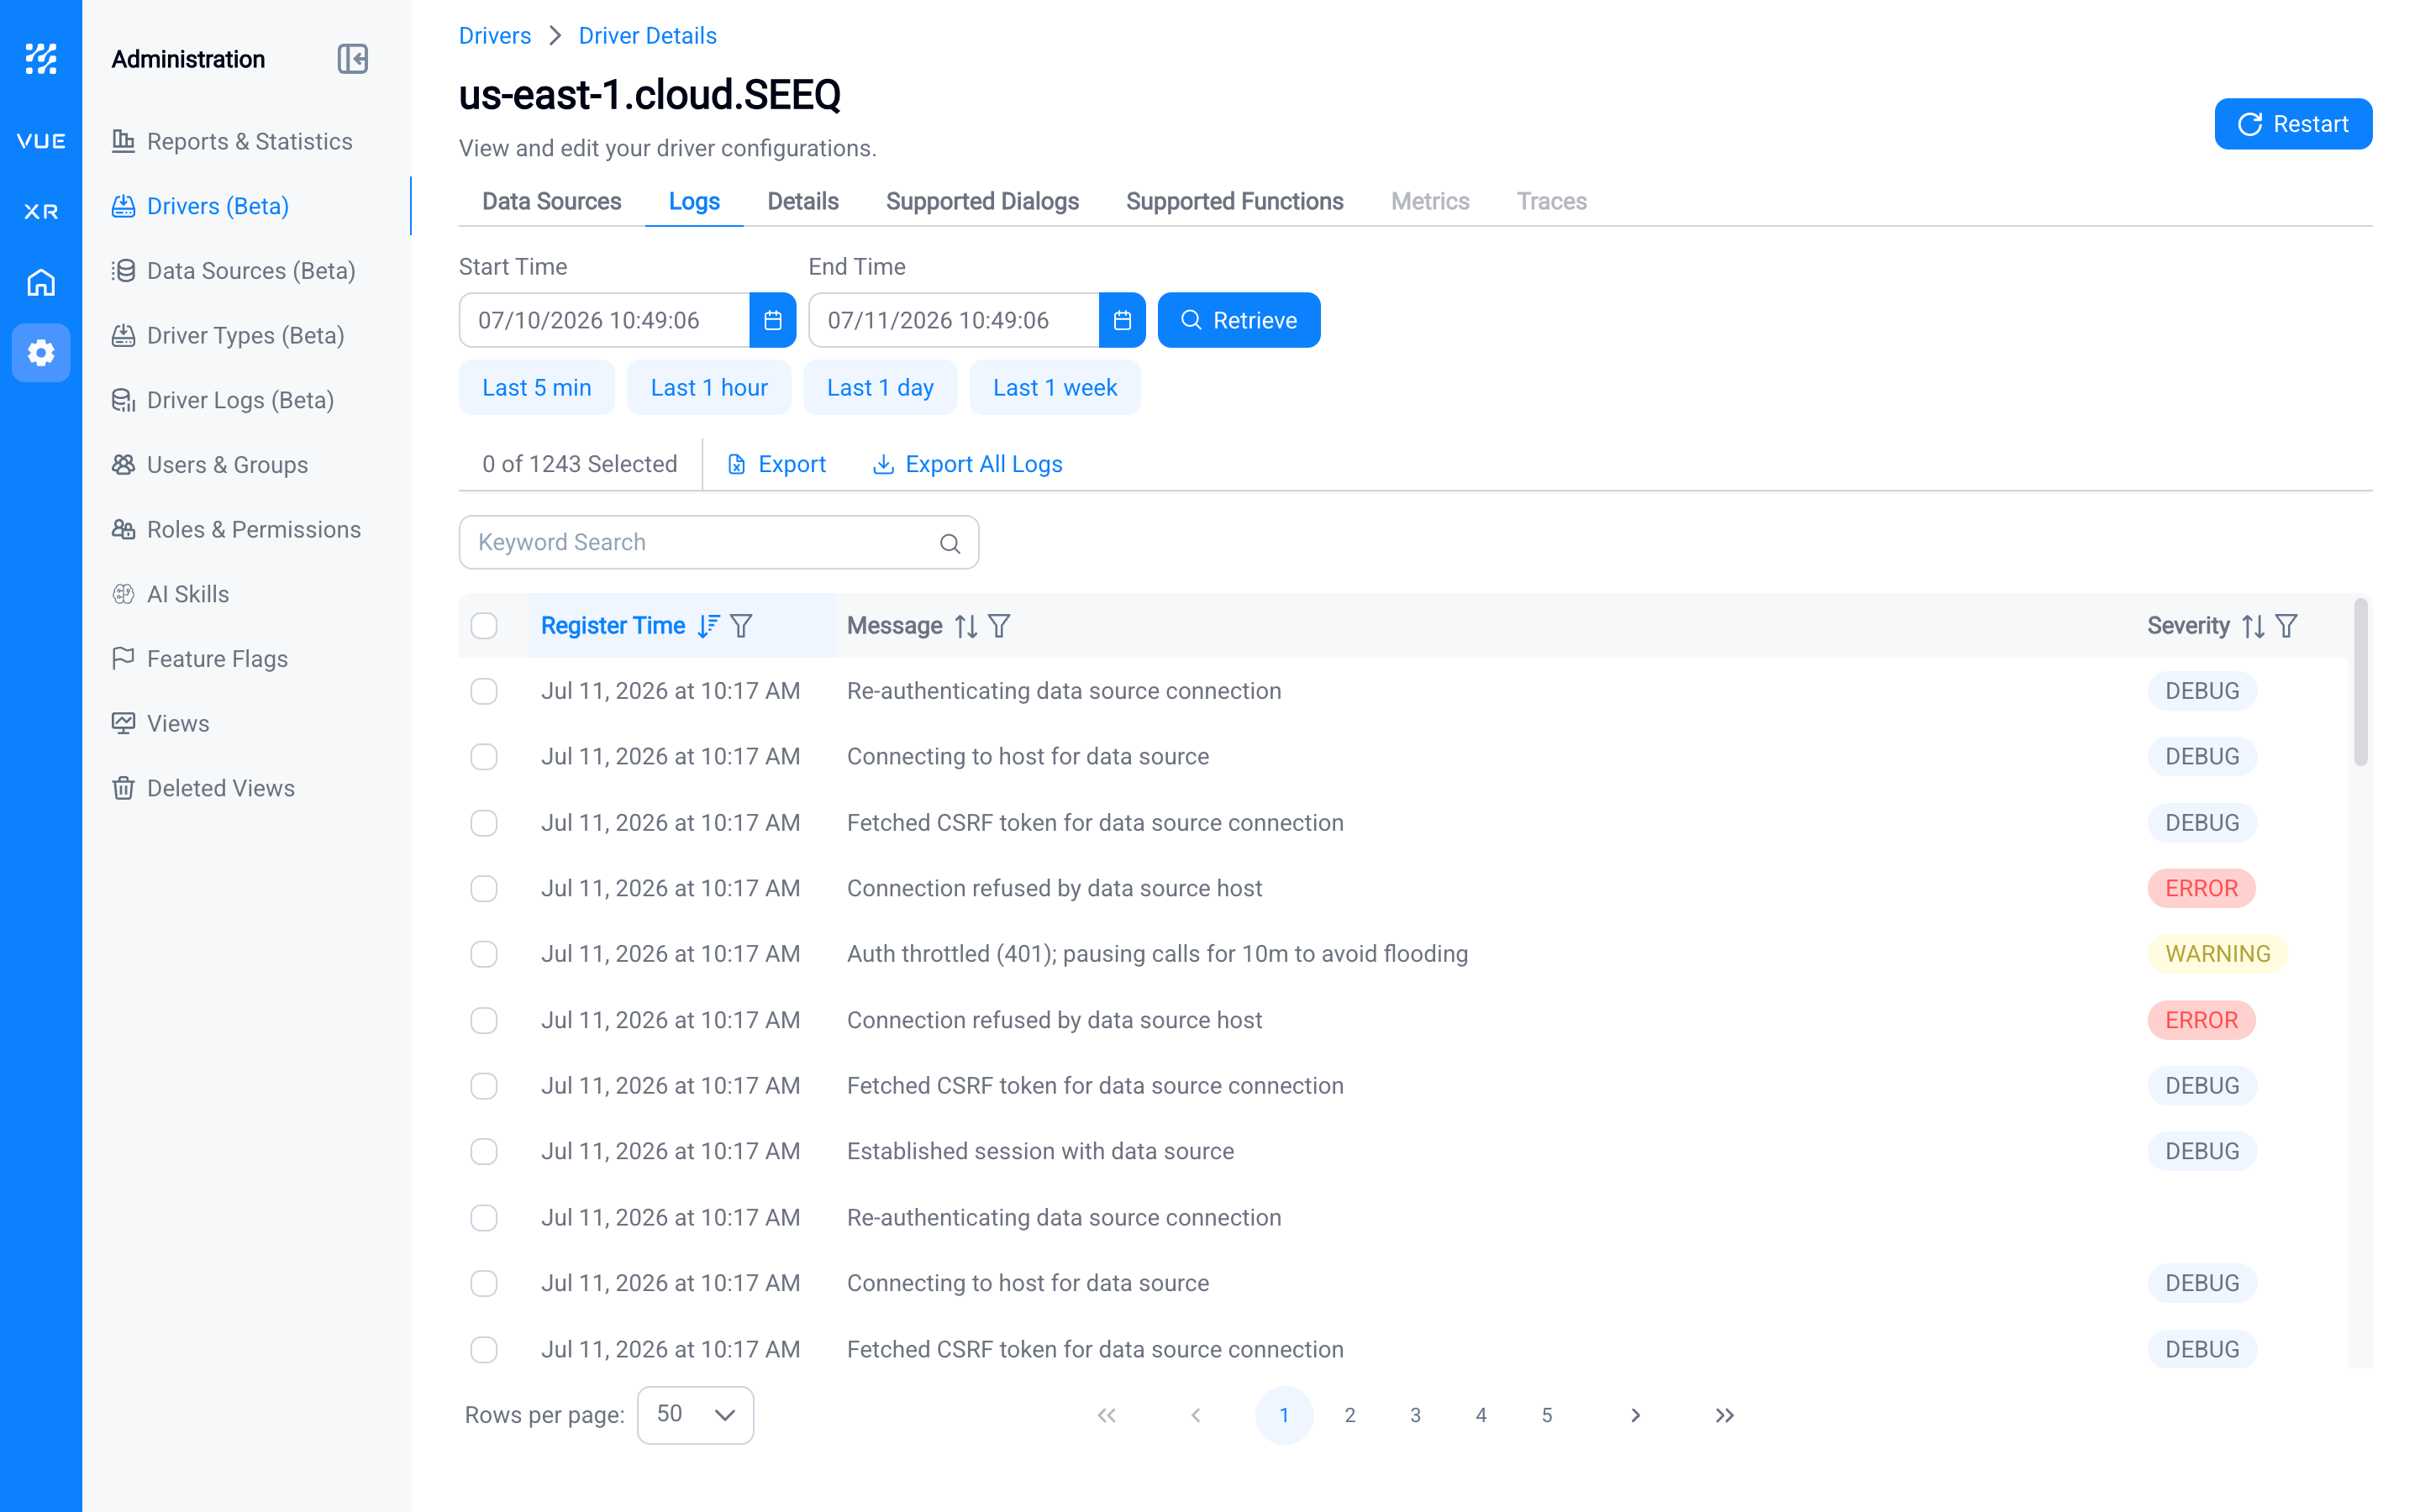
It offers two export options:
- Export: downloads the entries you have selected in the table. Use it when you have already narrowed things down to the rows that matter.
- Export All Logs: downloads the driver's log entries since its last restart. This is the one to reach for when troubleshooting: it captures everything the driver has recorded during its current run, which is usually exactly what support needs to diagnose an issue.
Troubleshooting a driver
When a driver misbehaves, open its Logs tab and use Export All Logs (logs since last restart) to send a focused, current snapshot to IOTA Support.
Note
Driver logs are read-only: you can view and export them, but not edit or delete individual entries. How long logs are retained is controlled by the driver's own infrastructure, not by this page.
What's Next
Continue to Feature Flags to turn platform features on or off for your instance.
Related
- Administration Page: the central admin console
- Roles, Users, and Groups: access control
- Troubleshooting: using the driver log to diagnose issues