
When something looks wrong (missing data, stale values, or an unexpected error), IOTA gives you a few built-in tools to find the cause, and a clear path to get help if you can't resolve it yourself.
Check the Notification Bell
When troubleshooting any issue, first take note of the messages in the notification bell in the top bar. It collects errors, warnings, and informational messages from the data source and driver layer; a badge shows the number of unread messages.
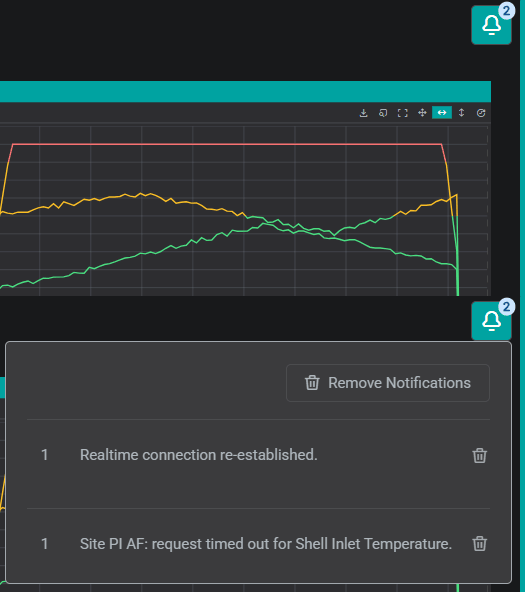
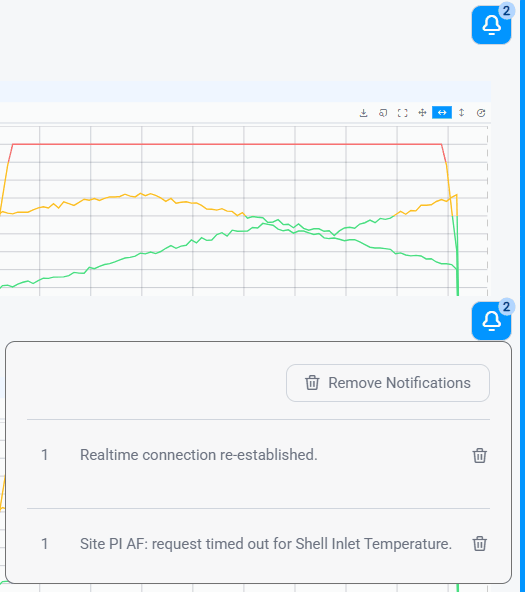
A useful first step is to clear the messages, then reproduce the problem, reload the page or reopen the display, and watch whether the same error appears again. If it does, you have narrowed down what triggers it. For the full notification workflow (clearing, and enabling or disabling messages), see Troubleshooting & Notifications.
Check a Component's Configuration
When a single component is misbehaving (showing the wrong data, the wrong appearance, or an unexpected value), its own configuration is often the fastest place to look. Unlock the display, right-click the component, and choose Inspect to view its full configuration (channels, settings, and actions) as JSON. See Inspecting a Component.
Open the Driver Log
For a deeper look at what's happening between IOTA and your data sources, open the Driver Log from the menu in the top-right corner (the ≡ icon) and select Driver Log.
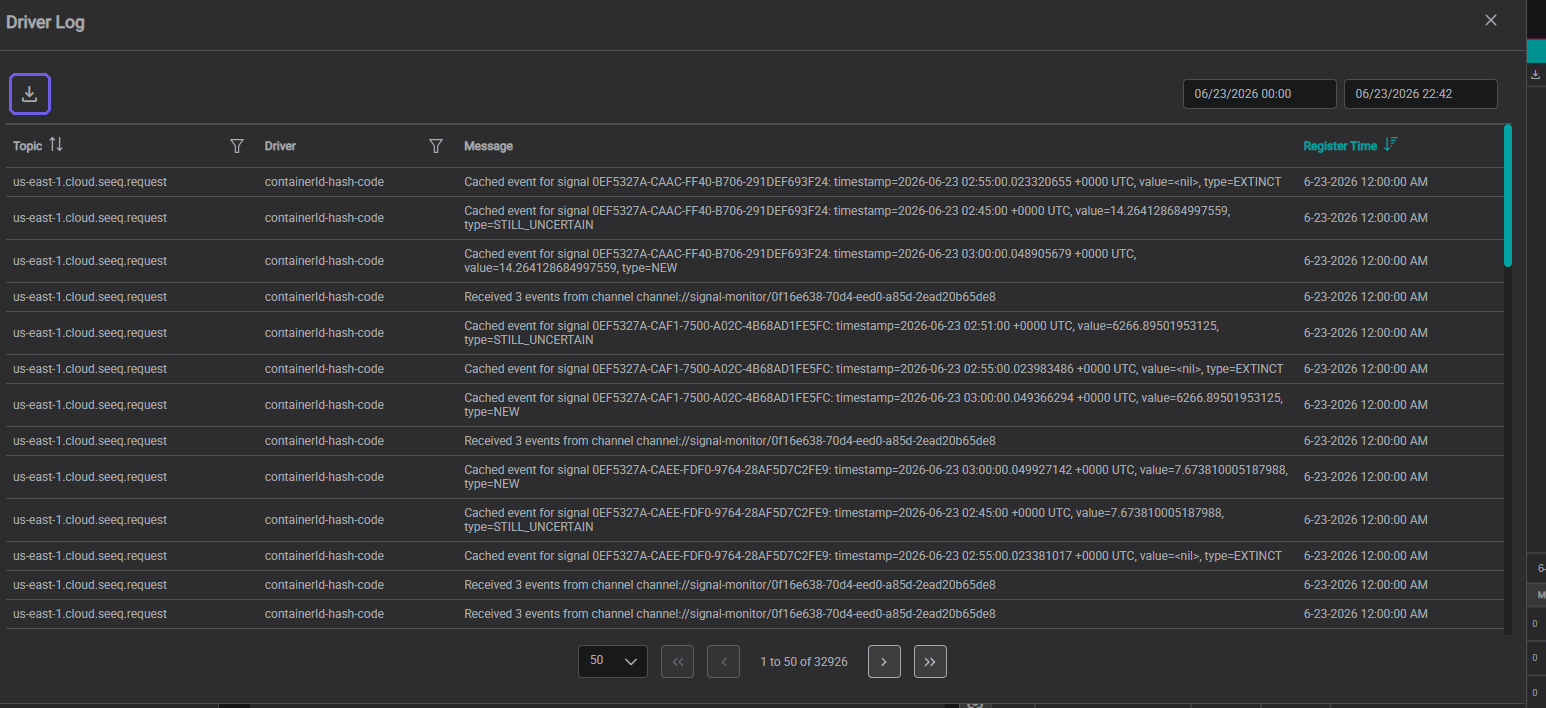
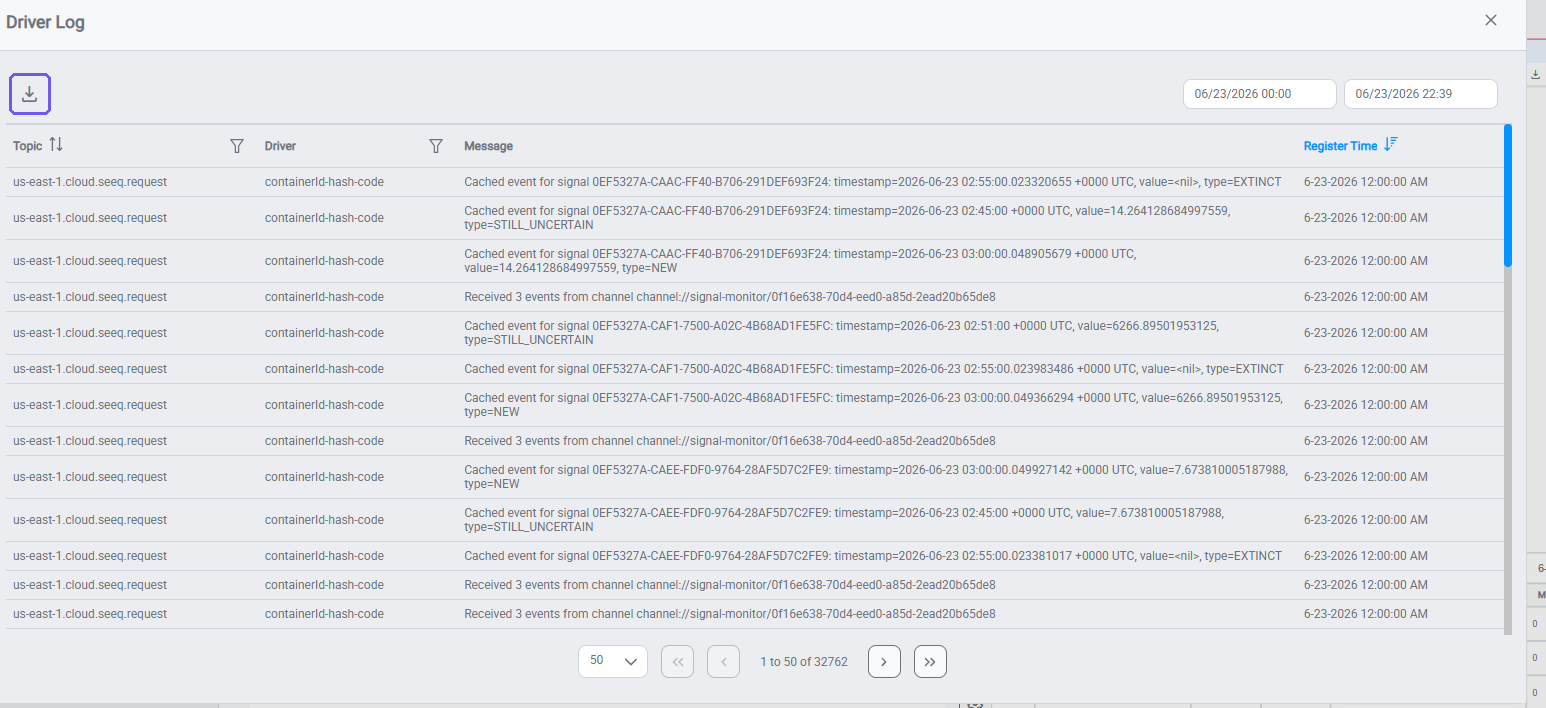
The Driver Log shows all backend requests by topic, driver, and message. Use the date range pickers at the top to narrow the time window, and the filter icons on the Topic and Driver columns to isolate traffic from a specific connector. Look for messages that indicate errors or unexpected values: these point to which driver and which signal is causing the issue.
To save the log for a support ticket, click the download icon (highlighted, top-left of the dialog) to export the currently filtered entries to a file.
Tips
Administrators can review driver activity across the whole instance, with severity color-coding and per-driver export, in Administration → Driver Logs.
Diagnosing Slow Loads
When a display loads slowly, identify which data source is responsible before changing anything in the display, if the source itself is slow, no script or component tuning will fix it. The Driver Log (above) shows each request's source and duration; a source that consistently takes more than a second is the bottleneck, not the display. Response time and behavior vary by source type.
Tips
Driver Logs require admin permissions. If you don't have access, note the display name and the approximate time of the slowness and share them with your administrator.
PI / AF Historian
The AF-Driver is stateless: it maintains no local cache, so every request goes directly to the PI server. Large AF structures add measurable latency to asset search, component training, and navigation-driven views.
Signs of a PI AF performance problem:
- Asset search in the Search panel is slow or times out
- Training a component to an asset takes much longer than expected
GoTonavigation feels sluggish
These symptoms are almost always caused by the PI AF configuration (broken attribute references, analyses in error state, or overly complex templates), not IOTA itself.
Support resources
- PI AF Configuration Best Practices for Optimal IOTA Performance: covers broken references, analyses in error state, substitution parameter issues, and a full diagnostic checklist
Seeq
The Seeq Driver is stateless: every request goes to Seeq with no local cache. Seeq itself caches computed signal values on demand: the first request for a new time range triggers a full recalculation. Subsequent requests for the same range return quickly.
This means:
- Seeq-backed displays are slow on first load and fast on repeat views
- Wide time ranges are slower because Seeq must compute more samples
- Under high concurrent load, Seeq's LongRunning thread pool can saturate: all IOTA requests queue and users see blank charts or 20–60+ second load times
To reduce cold-start delays, limit Seeq-based channels to the narrowest time range users actually need, and load Seeq data on interaction rather than at page open where possible.
Support resources
- Make your Seeq screens load fast (caching): how to enable the Seeq Cache Puller to pre-load signal data so screens open instantly
- Improving Seeq Data Performance: Cache Puller configuration and Seeq server-side thread pool tuning
- Seeq performing poorly: Diagnosing LongRunning thread queue saturation: step-by-step diagnosis when displays take 20–60+ seconds to load
SQL, Databricks, and Cloud Analytics Sources
SQL databases and cloud analytics sources (Azure Data Explorer, Snowflake, Databricks) have no native IOTA caching layer. Every display load triggers a live query against the source.
The most common cause of slow loads is a wide time range against a table or view without appropriate indexing. Work with your database administrator to confirm that the timestamp column used in IOTA queries is indexed and that the query pattern aligns with existing indexes.
Load times of 5–60 seconds are normal for analytics sources. Anything beyond 60 seconds typically points to a missing index, an overly broad dataset, or a network issue between the IOTA server and the source.
Infrastructure and Network
Some performance problems are outside IOTA's control:
- A PI Server shared with heavy consumers (other SCADA systems, data feeds, batch processes) will be slower at peak load times
- Seeq running as SaaS (cloud-hosted) adds internet round-trip latency compared to an on-prem deployment
- Network hops between the IOTA server and the data source add latency: the AF-Driver should be deployed on the same LAN segment as the PI Server
If the Driver Log shows consistently high latency without errors and the display has not changed recently, suspect infrastructure load or network degradation rather than a display configuration problem.
Support resources
- Troubleshooting Basics: step-by-step triage for slow displays, blank charts, and timeout errors; covers the notification bell, Driver Log, and browser DevTools
Gather Diagnostics for a Ticket
If the Driver Log doesn't show a clear cause, collect a few artifacts before contacting support. They let the IOTA team reproduce and diagnose your exact situation quickly.
Export a copy of the view (.b64)
Send support the exact display where you see the problem. Open the view's additional menu and click Download View to save it as a .b64 file. Support can upload that file to reproduce your display precisely. See Downloading a View for details.
Capture a HAR file (network trace)
When the problem is data not loading, partial results, or slow responses, a HAR file records every network request your browser made: invaluable for diagnosing connectivity and API issues. To record one in Chrome or Edge:
- Press F12 to open Developer Tools, then select the Network tab.
- Enable Preserve log so requests aren't cleared when the page reloads.
- Reload the page or reproduce the problem so the requests are captured.
- Click the Export HAR (download ⬇) button, or right-click any request and choose Save all as HAR with content.
- Save the
.harfile and attach it to your ticket.
Warning
A HAR file can contain session tokens and the data returned to your browser. Share it only with IOTA support, and only for the affected view.
Export the Driver Log
Use the download icon in the Driver Log dialog (see above) to save the driver activity as a file. Filter to the relevant driver and time range first so the export stays focused on the problem.
Open a Support Ticket
If an issue keeps appearing or you can't resolve it, open a ticket with the IOTA team:
Need help?
To help us resolve it quickly, include as much of the following as you can:
- The notification message text, and when it appeared.
- A copy of the view (
.b64) where the problem occurs. - A HAR file if the issue involves data loading, partial data, or performance.
- The Driver Log export, filtered to the relevant driver and time range.
- Screenshots of the problem, and the steps to reproduce it.
What's Next
If the problem is on the viewing side, see Troubleshooting & Notifications for the end-user notification workflow.
Related
- Driver Logs: instance-wide driver activity and export
- Troubleshooting & Notifications: the viewer-side workflow
- Architecture & Deployment: deployment and infrastructure context