
ParallelChart
Less than 1 minutecomponentsdata
The ParallelChart draws a parallel-coordinates plot: several vertical axes side by side, with each record drawn as a line crossing every axis. It's a way to see relationships across many dimensions at once.
Preview only
ParallelChart is an early preview. It currently renders a fixed sample dataset to demonstrate the parallel-coordinates layout and does not yet plot your bound channels. Its only settings today are the basic Visual Properties (border and background). Use it to evaluate the visualization; check back as it matures before relying on it in a production display.
Generic Settings
Being a preview, ParallelChart exposes only the standard component frame:
Rotation and Position
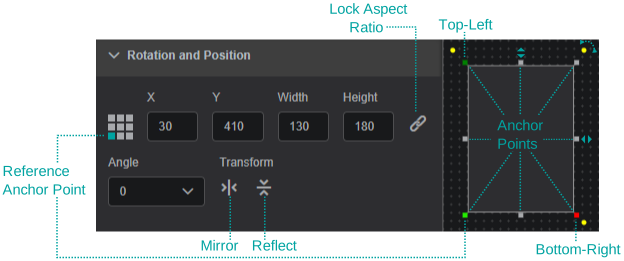
Reference Anchor Point- allows you to select one of the anchor points as a reference so that you can set anAngle(clockwise) of incline relative to this point.
By default the reference anchor point is the top left corner. You can also rotate the component by dragging one of the yellow corner points.- You can set the position of the component by setting the
XandYcoordinates relative to theReference Anchor Pointand the top-left corner of the work area. - You can drag any of the anchor points to change the width and height of the component, or you can set it manually by editing the
WidthandHeightboxes. - Set
Lock Aspect Ratioso that while changing width and height, the component width to height ratio stays the same Transformallows you to view the component as a mirror or a reflection of itself
Visual Properties
Border Color/Border Width/Border Radius.Background Color.
Related
- BubbleChart: another multi-dimensional comparison view
- XY Chart: correlate two signals