
Merging Data Sources
Merging Data Sources
IOTA can display data from multiple sources in the same view: PI historian data alongside Seeq calculations, SQL database records next to real-time sensor values, or signals from two different sites on the same trend. Each component channel has its own data source selector, so mixing sources is a per-channel decision.
When You Need This
Consider a multi-source display when:
- An overview display needs KPI values from your historian alongside contextual metadata from a SQL database (batch records, production targets, shift schedules)
- You want to show live process data from PI next to advanced analytics or lab results from Seeq
- Two sites use separate PI servers and you need side-by-side comparison in one trend
- A calculation exists in Seeq that is not available as a raw PI tag
How It Works
Every component in IOTA has one or more channels. Each channel represents one data stream shown by that component. Each channel independently specifies:
- Which data source to query
- The tag, asset attribute, or dataset to pull from that source
A single Line Chart can have four channels (two pulling from a PI server, one from Seeq, and one from Azure Data Explorer), and they all render on the same chart with the same time axis. The GTC applies to all time-aware channels regardless of source.
Setting the Data Source Per Channel
- Select a component and open the Settings panel.
- Navigate to the Channels tab.
- For each channel, use the Data Source dropdown to select the source.
- Open the Search panel, switch to the matching data source, then search and drag the tag, attribute, or dataset onto the channel.
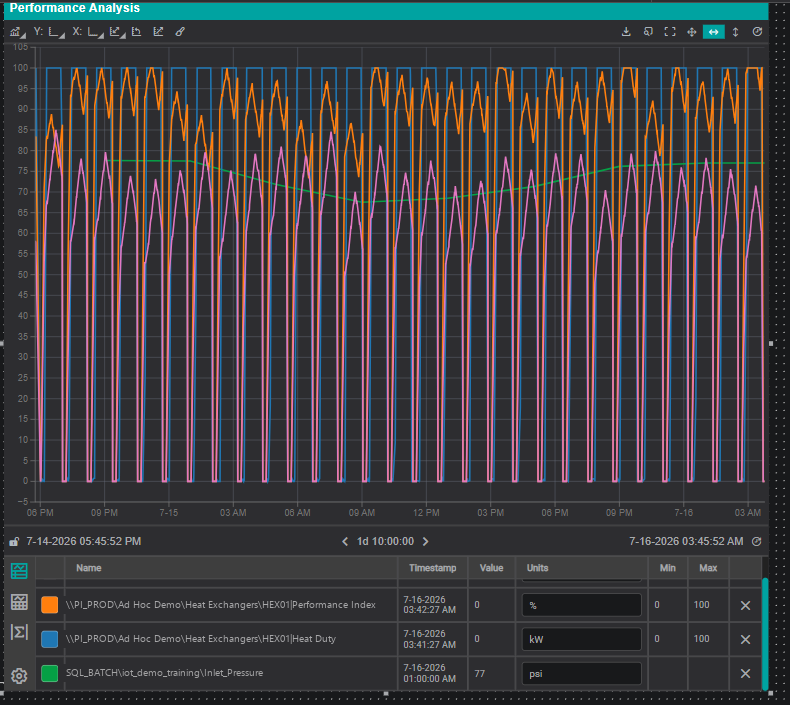
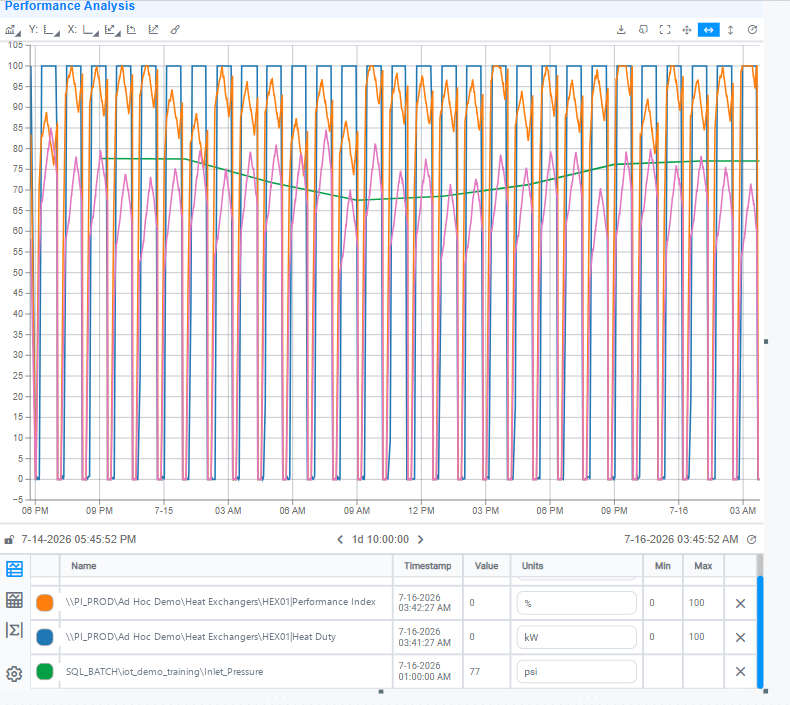
Repeat for each channel that needs a different source. The component renders data from all channels together once each source returns its result.
What to Expect by Source Type
Response time and behavior vary significantly across source types. Build with these differences in mind:
| Source type | Best for | Typical latency |
|---|---|---|
| PI / AF Historian | Real-time process data, high-resolution trends | Sub-second |
| Seeq | Advanced calculations, lab context, signal analysis | Seconds |
| SQL / Relational DB | Structured records, batch data, metadata | Seconds to tens of seconds |
| Databricks | Analytics workloads, large-scale batch and ML data | Seconds to minutes |
| Azure Data Explorer / Snowflake | Large-scale historical queries, analytics workloads | Seconds to minutes |
Tips
For real-time operational displays, use PI or another historian as the primary data source. Pull Seeq and SQL data for context or supplementary analysis, not as the main signal feed. Limit time windows on SQL and analytics sources to keep load times acceptable: a wide time range against a slow source can stall the entire display render.
Planning Your Data Source Configuration
Before building a multi-source display, confirm with your administrator which sources are active in your IOTA instance and which source name maps to which system. Use a simple table to document this:
| Source name in IOTA | System | Cloud / On-Prem | What it contains |
|---|---|---|---|
| PI_PROD | OSIsoft PI Server | On-Prem | Real-time process historian |
| SEEQ_MAIN | Seeq Cloud | Cloud | Calculations, lab data |
| SQL_BATCH | SQL Server | On-Prem | Batch records and production targets |
Source names are set by the administrator. They may not match the underlying system name exactly. Getting this mapping from your admin before building saves time.
A source only appears in IOTA after its driver has been configured. For the full list of supported connectors and their setup, see Data Source Drivers.
Go to Seeq
For any component with at least one channel bound to a Seeq-connected data source, you can open the current signals and time range directly in Seeq Workbench. Right-click the component while in locked (viewer) mode and select Go to Seeq. See Go to Seeq for supported components and requirements.
When a Display Loads Slowly
A multi-source display renders at the speed of its slowest source: one slow historian query or analytics scan holds up the whole render. To find which source is responsible, check the Driver Log and diagnose by source type in Troubleshooting → Diagnosing Slow Loads.
What's Next
With your data sources merged into one display, the next step is composing more complex layouts: embedding other views and organizing content into tabs. Continue to Organizing Complex Displays.
Related
- Searching for Tags, Assets & Datasets: using multiple data source tabs in Search
- Calculations: PI system and Python calculations as a data source
- Go to Seeq: open selected signals in Seeq Workbench
- Scripting Performance & Scale: script-specific performance traps: GTC-triggered loops, too many concurrent charts, bulk script management
- Troubleshooting: diagnose slow loads by data source, and gather diagnostics for a support ticket
Driver documentation (administrator setup required before a source appears in IOTA):
- AVEVA PI Data Archive: on-prem OSIsoft/AVEVA PI historian
- AVEVA PI AF: asset framework and hierarchy driver
- Seeq: analytics and calculation engine
- Databricks: analytics workloads, batch data, and ML datasets via Generic SQL
- Azure Data Explorer: large-scale time-series and log analytics
- Snowflake: cloud data warehouse
- Generic SQL: SQL Server, MySQL, PostgreSQL, Oracle, Azure Synapse, and more