
Multistate Behavior
Multistate Behavior
Multistate changes a component's visual appearance based on a data condition: coloring a KPI table cell green when a reading is within range and red when it crosses a threshold, or changing a Value component's color when a temperature goes out of normal range.
In the heat exchanger display, multistate is applied to the KPI Table (the Value cells for Thermal Effectiveness, Performance Index, and Heat Duty) and to individual Value components showing temperatures and flow rate. This page walks through configuring both.
Adding Multistate to a Component
Multistate can be configured two ways, and the difference is one of scope: what gets restyled. Both are reached from the component's Settings panel (see Generic Settings for the sections every component shares):
- Conditional Formatting: Settings → Component Specific → Conditional Formatting → Configure Multi-State. Formats individual cells within a chosen column (Value, Name, …) across every row. This is the cell/column-level route, available on components that expose it such as the Table.
- onData action: Settings → Actions → onData → Multistate. Restyles the whole component based on its channel(s): fill/border color, visibility, or blink. Available on the Table, Value, SVG, and other data components.
They're not mutually exclusive: a Table can use Conditional Formatting to color a column's cells and an onData Multistate action to restyle the entire table, for example, blink or border the whole table when any reading alarms. In short; use Conditional Formatting for per-cell/column coloring, and an onData action for whole-component effects. Both share the same rule model (Operator / Value / color, evaluated in order); the rest of this page shows each.
On a Table: Conditional Formatting
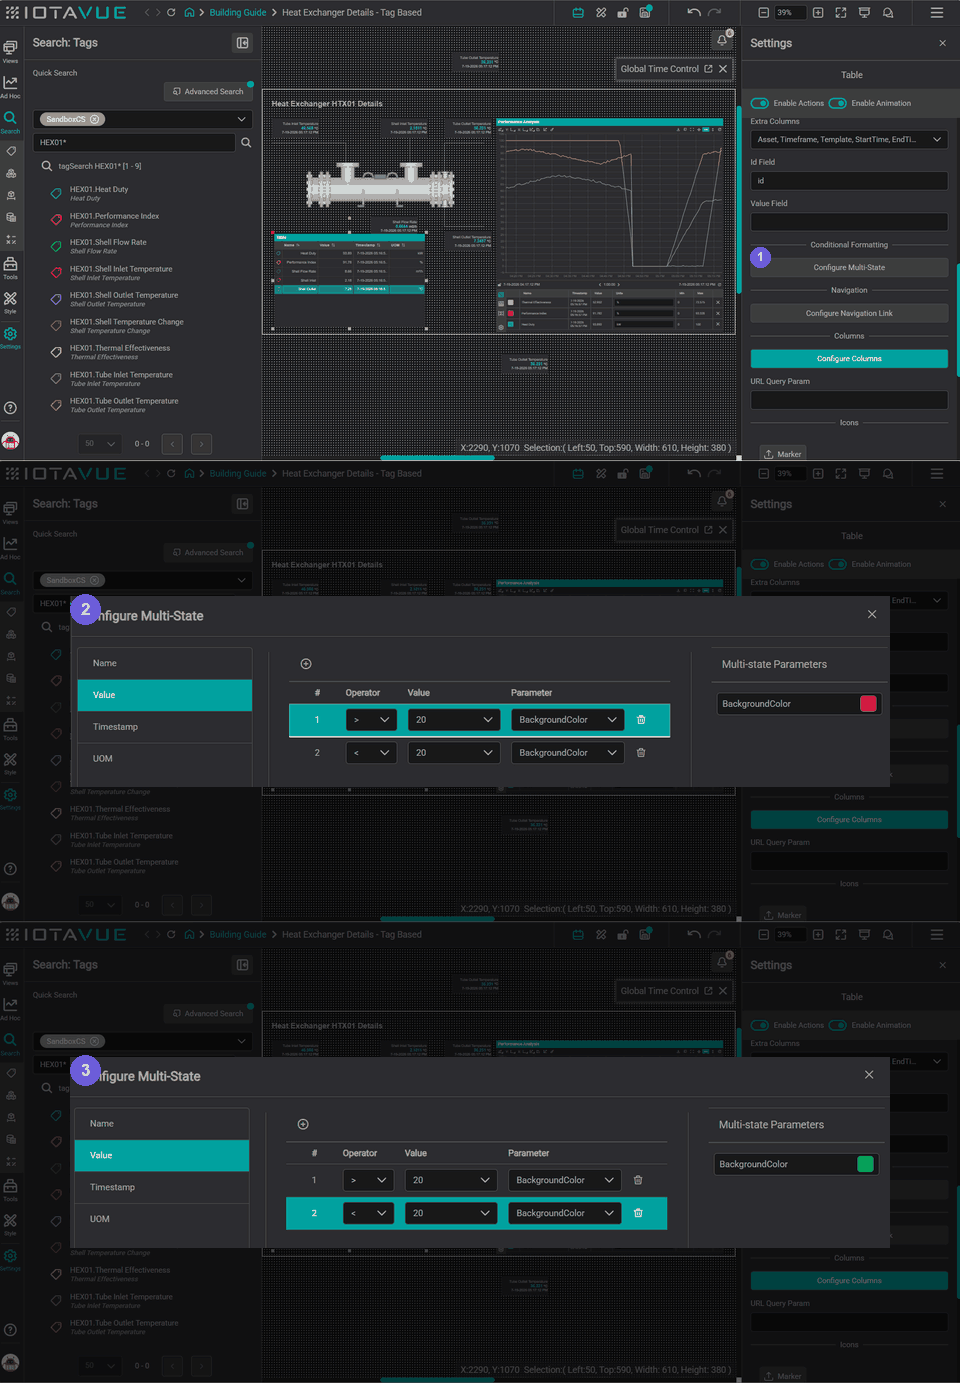
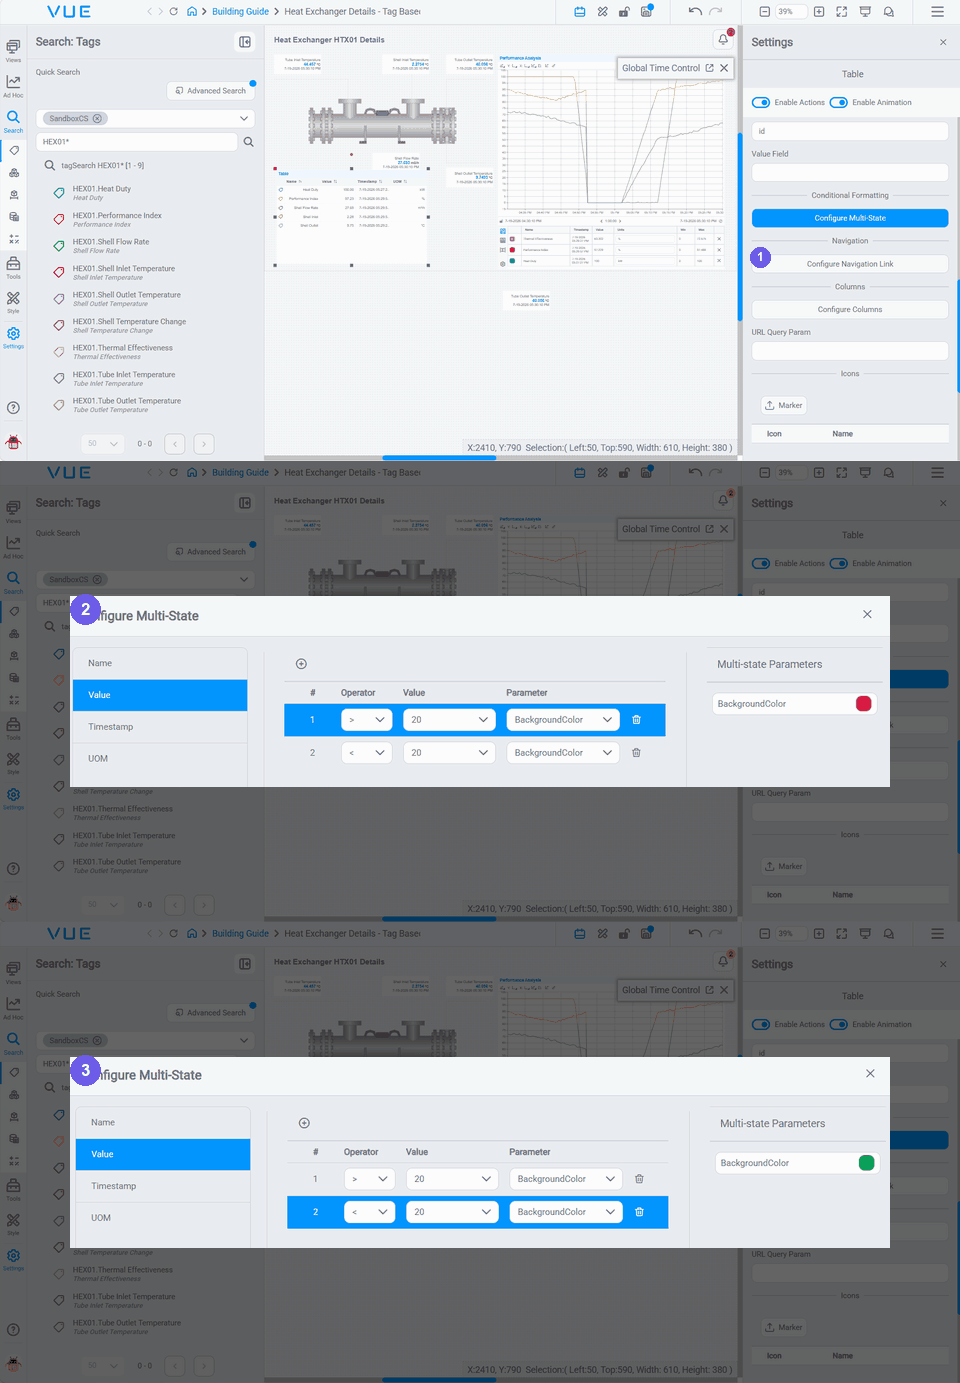
Open the Configure Multi-State dialog from the Settings panel: expand Component Specific → Conditional Formatting and click Configure Multi-State. The dialog has three parts, on the left, the columns you can format (Name, Value, Timestamp, UOM); in the center, the state rules for the selected column (# / Operator / Value / Parameter); on the right, the Multi-state Parameters for the selected rule, where you pick the color.
Example: color a table column by threshold
The heat exchanger KPI Table colors its Value column red when a reading is above a limit and green when it's below:
- Select the Table, then in the Settings panel expand Component Specific and under Conditional Formatting click Configure Multi-State.
- In the dialog, pick the Value column on the left, click + (Add State), and set the first rule (Operator
>, Value20, ParameterBackgroundColor), then pick red in Multi-state Parameters. - Click + again for the opposite rule (Operator
<, Value20, ParameterBackgroundColor, color green), then click Apply. The rules apply to that column's cells across every row and are evaluated in order.
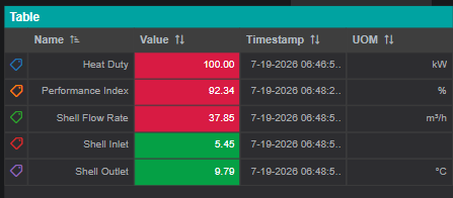
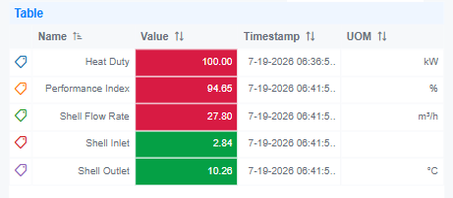
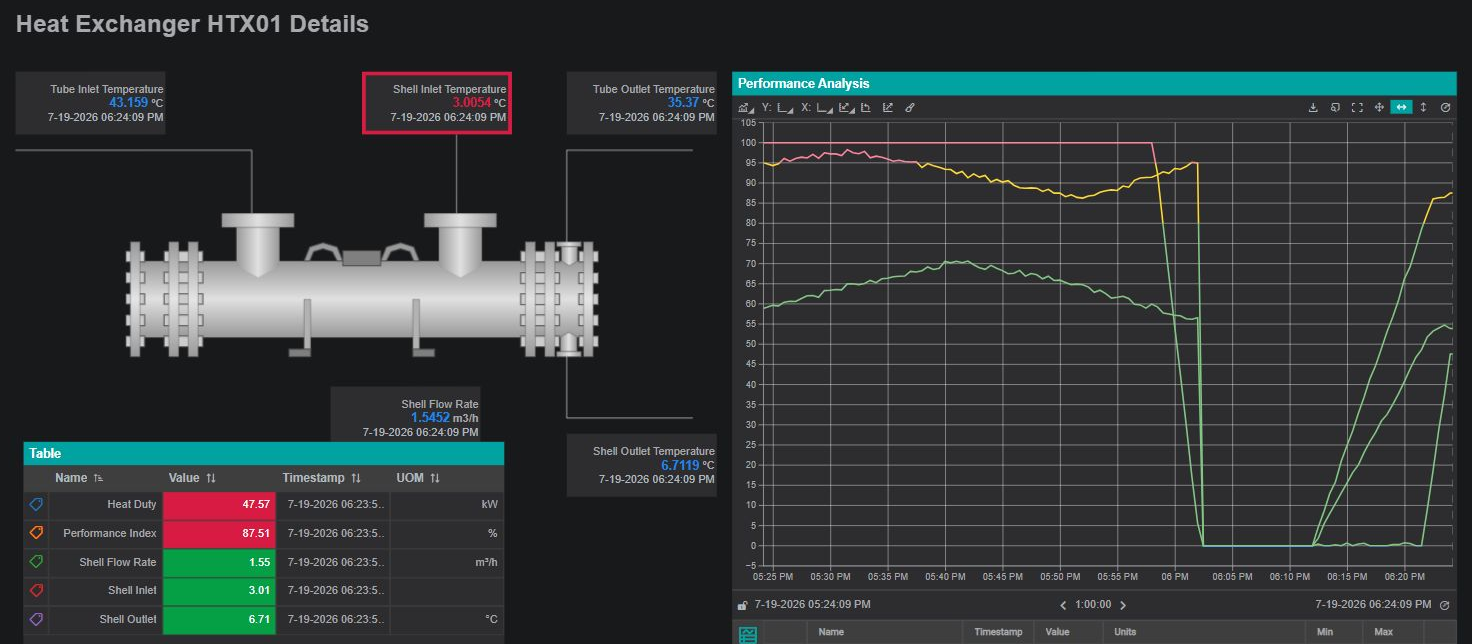
The result on the KPI Table: each cell in the Value column is colored by its own reading: red where it's above 20, green where it's below:
On a Value component: onData Multistate
A Value component's threshold coloring lives under Actions, not Conditional Formatting. Select the Value, open Settings → Actions → onData, and add Multistate rules there. Each rule has an Operator and Value, a channel selector (defaults to *: all channels), and visual properties: Value color, Border color, and Border width.
Example: color a value by threshold
Color a temperature or flow Value red when the reading goes out of range:
- Select the Value component, then open Settings → Actions → onData → Multistate.
- Add a rule (Operator
>, Value10), with Value color and Border color green. - Add the opposite rule: Operator
<, Value10→ red, with a Border width (e.g.,5) so the alarm stands out, then Apply.
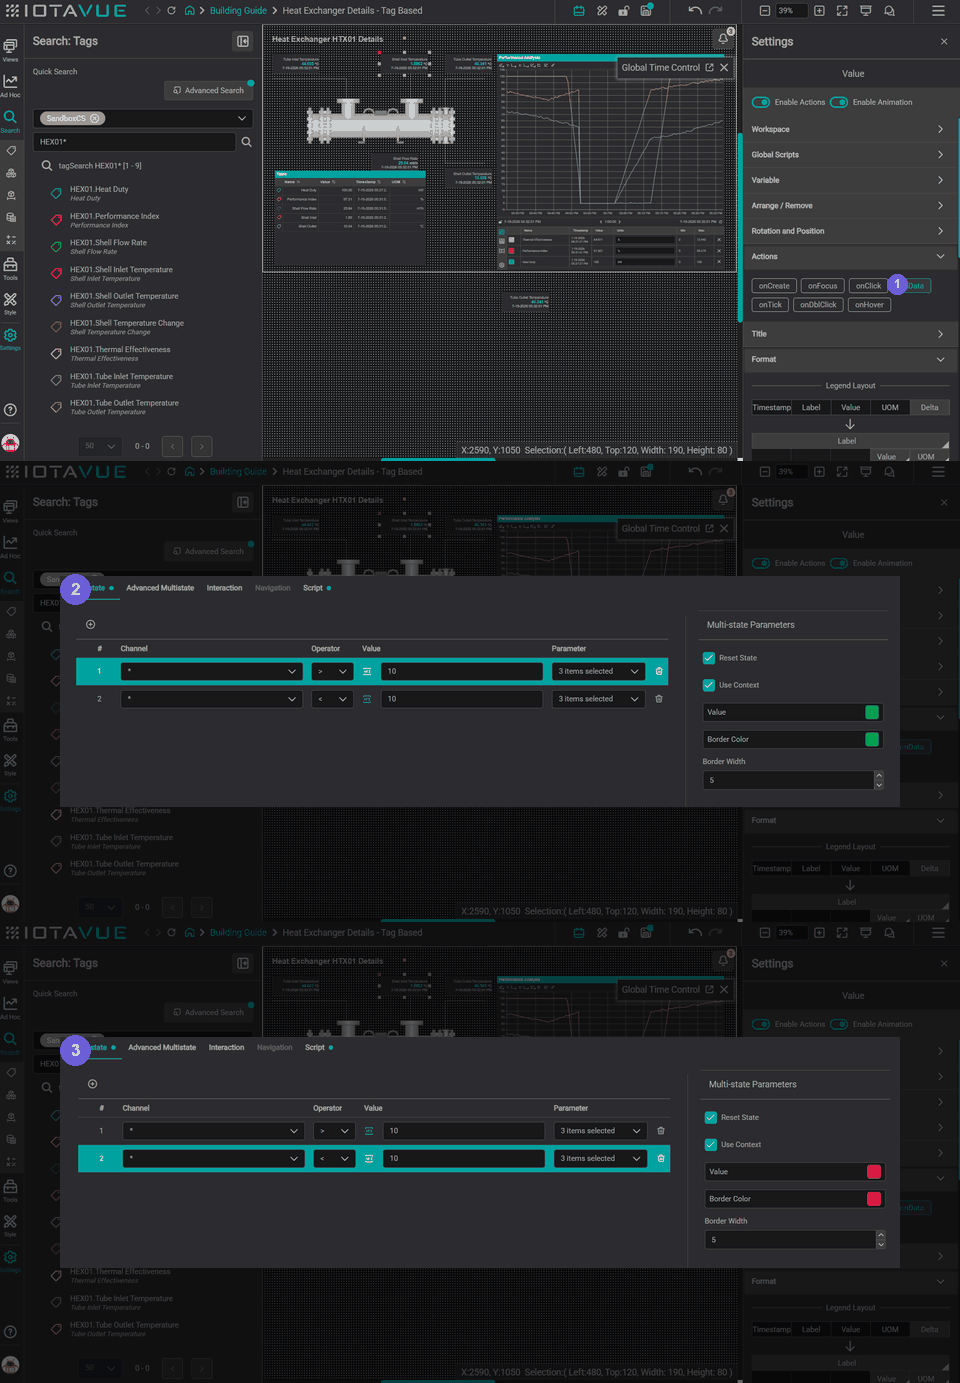
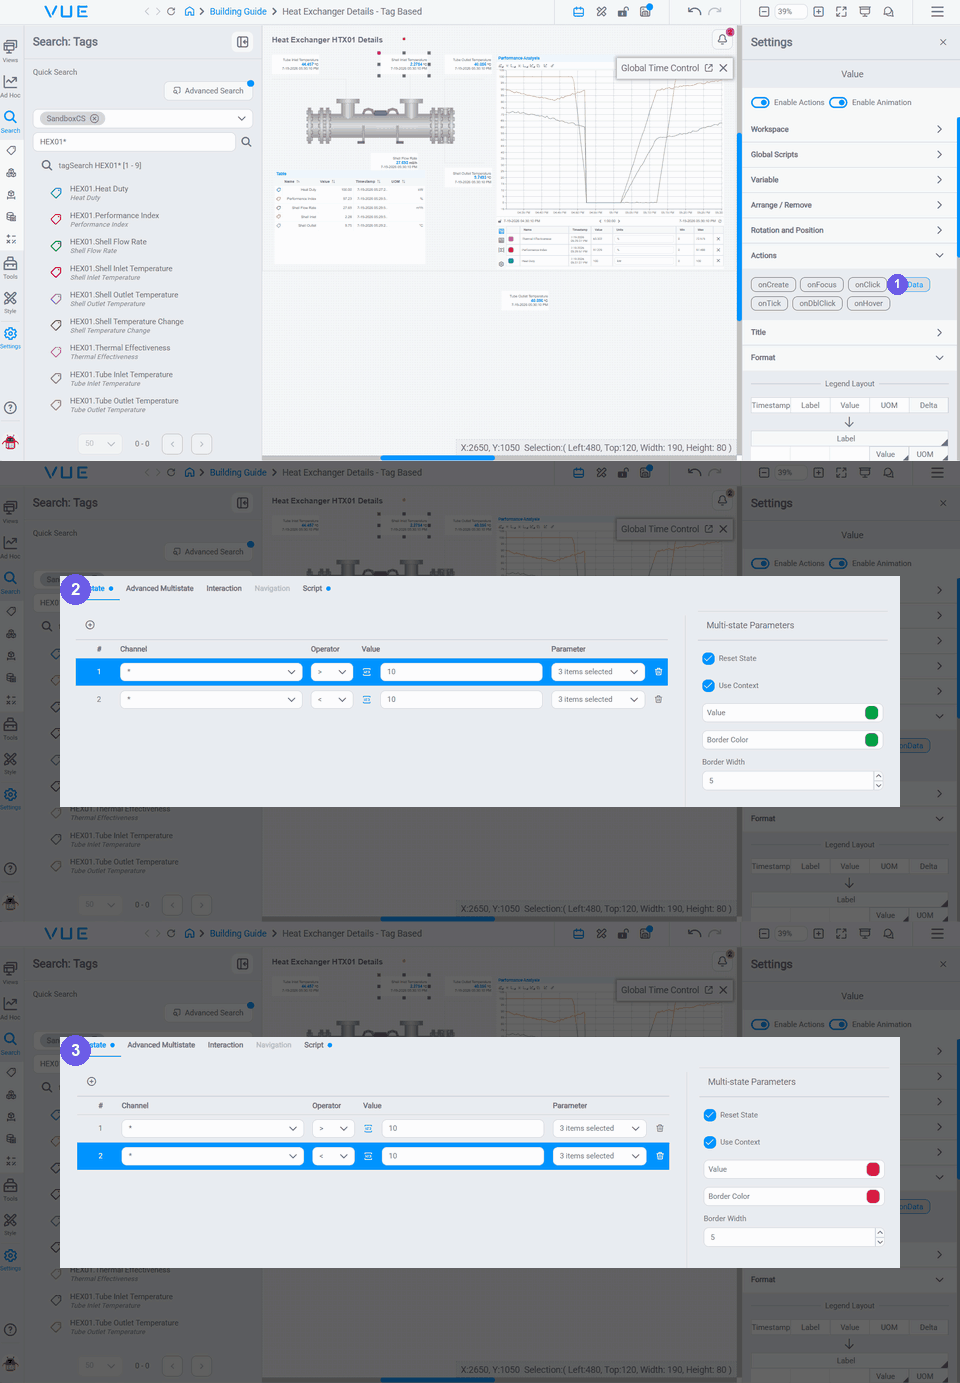
The result on the display, only the Shell Inlet Temperature value crosses its threshold, so it turns red while the others stay neutral:
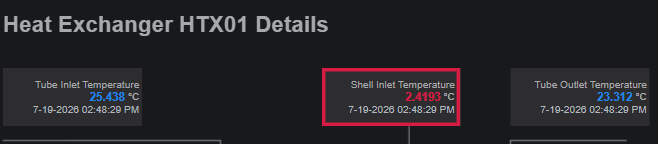
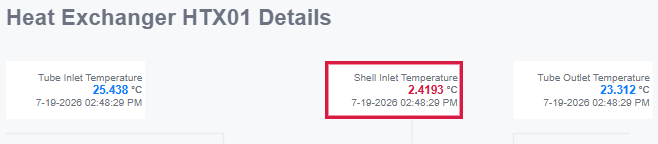
You can apply the same onData Multistate rules to any of the value components (Tube Inlet/Outlet, Shell Outlet, Shell Flow): it's simply a matter of which readings you want to draw attention to. Color the ones that matter most so operators notice them at a glance.
Making a component blink
Multistate can also make a component blink to draw attention to an alarm. Blinking is a visibility flash, the component repeatedly hides and reappears (roughly twice a second), not an alternation between two fill colors.
It's driven by the same rules as coloring: on a Value (or other data component), open Settings → Actions → onData → Multistate, add the rule for your alarm condition, and turn on its Blink parameter alongside (or instead of) the color change.
Two things to know:
- Blink only shows in a locked/viewer display. In edit mode the component stays put so you can still select it; lock the display to see it flash.
- Blink latches on. Once a rule turns blinking on, it stays on until another rule turns it off; add an opposite "in range" rule (for example a
*catch-all or a Good/quality condition) that clears it, so the component stops blinking when the value returns to normal.
On the Heat Exchanger Details display, the schematic itself is set up to blink when Shell Inlet Temperature drops out of range. To wire this up, the Shell Inlet Temperature tag was dragged directly onto the SVG component so it drives the schematic's state. Then, on the SVG, Settings → Actions → onData → Multistate holds a rule on that channel (Operator <, Value 10), and in the Multi-state Parameters panel the rule sets FillColor to red and turns on Blink:
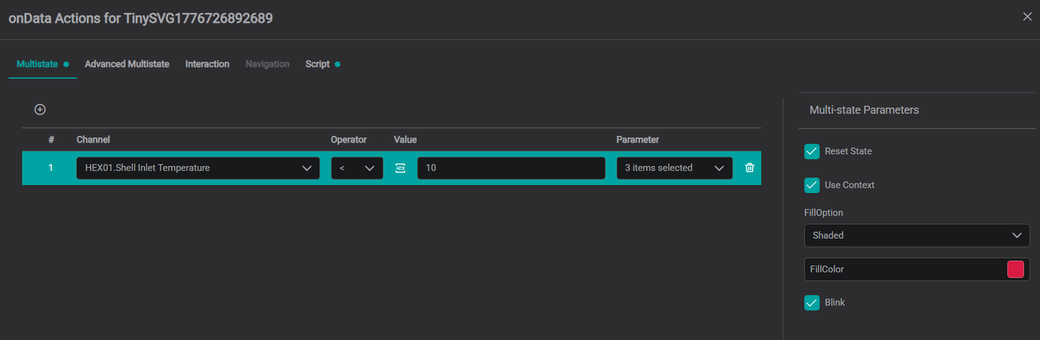
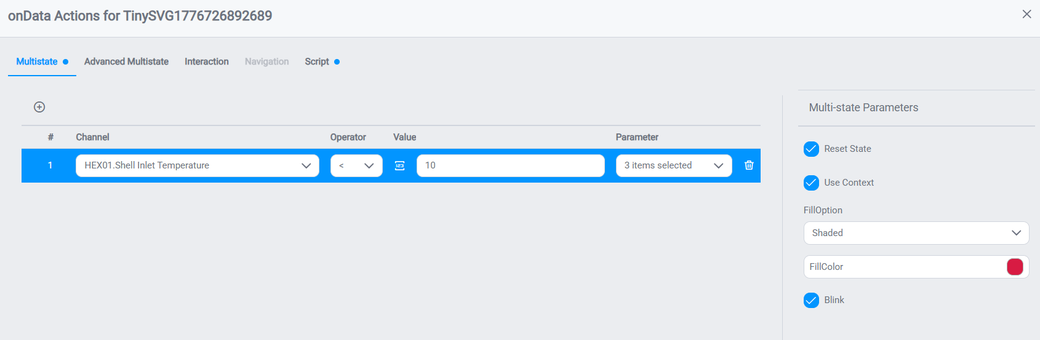
The rule targets a Channel: here HEX01\Shell Inlet Temperature, the tag dropped onto the SVG. Set the Channel to * to apply the rule to all of the component's channels, or select specific channels individually (as in this example).
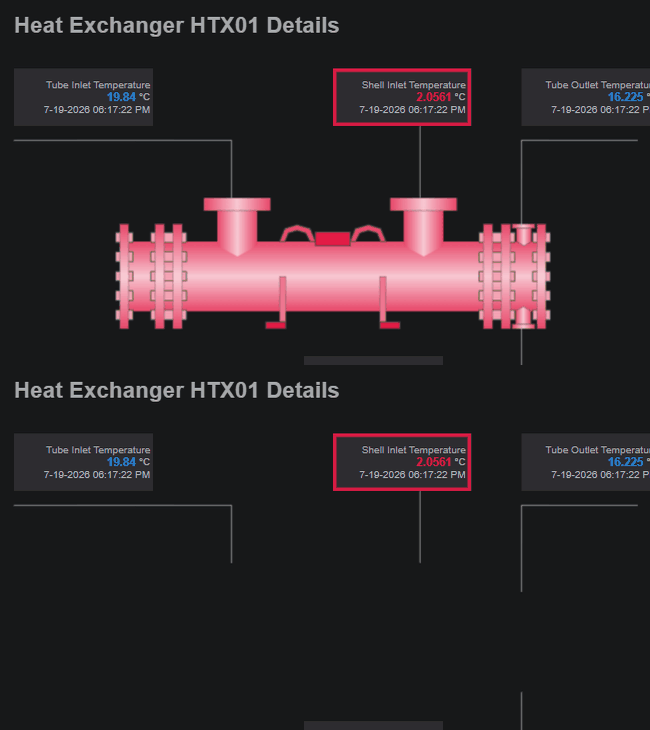
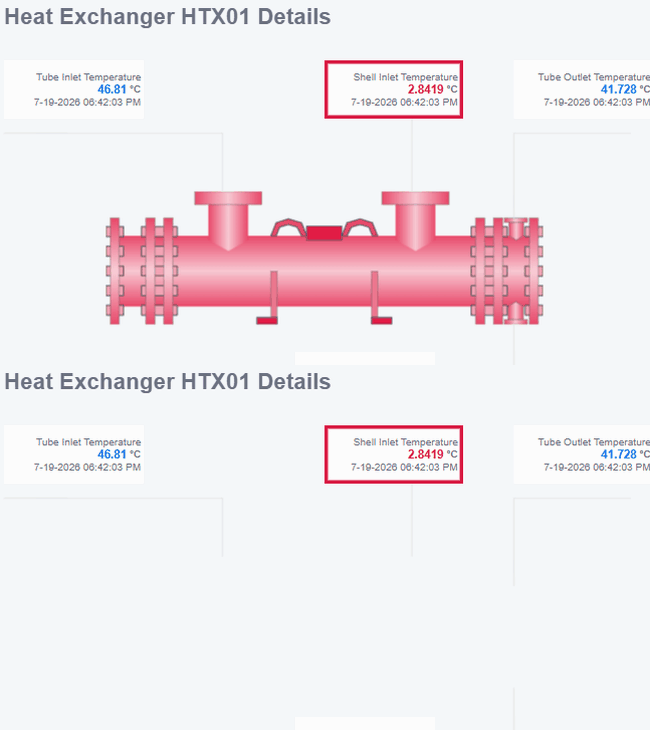
Locked, the schematic fills red and flashes, repeatedly hiding and reappearing, whenever the rule matches:
Advanced Multistate
Advanced Multistate is the second tab in the onData Actions dialog, next to Multistate. It's a more powerful variant for cases where the basic tab isn't enough: instead of one visual change per rule, you match rules per channel (channel / operator / value) and invoke a state function when a rule matches, so a condition can drive richer or custom behavior beyond a simple color, border, or blink.
Use it when you need:
- Per-channel logic: different rules for different channels on the same component.
- A function response: run a state function when a rule matches (for conditional behavior the basic tab can't express).
- XR / richer visuals: it also drives visual changes such as blink, color, and stroke width/type on XR components.
For most displays, the basic Multistate tab (color, border, visibility, blink) is all you need: reach for Advanced Multistate only when a rule has to do more than restyle the component.
Trace Formatting on Line Charts
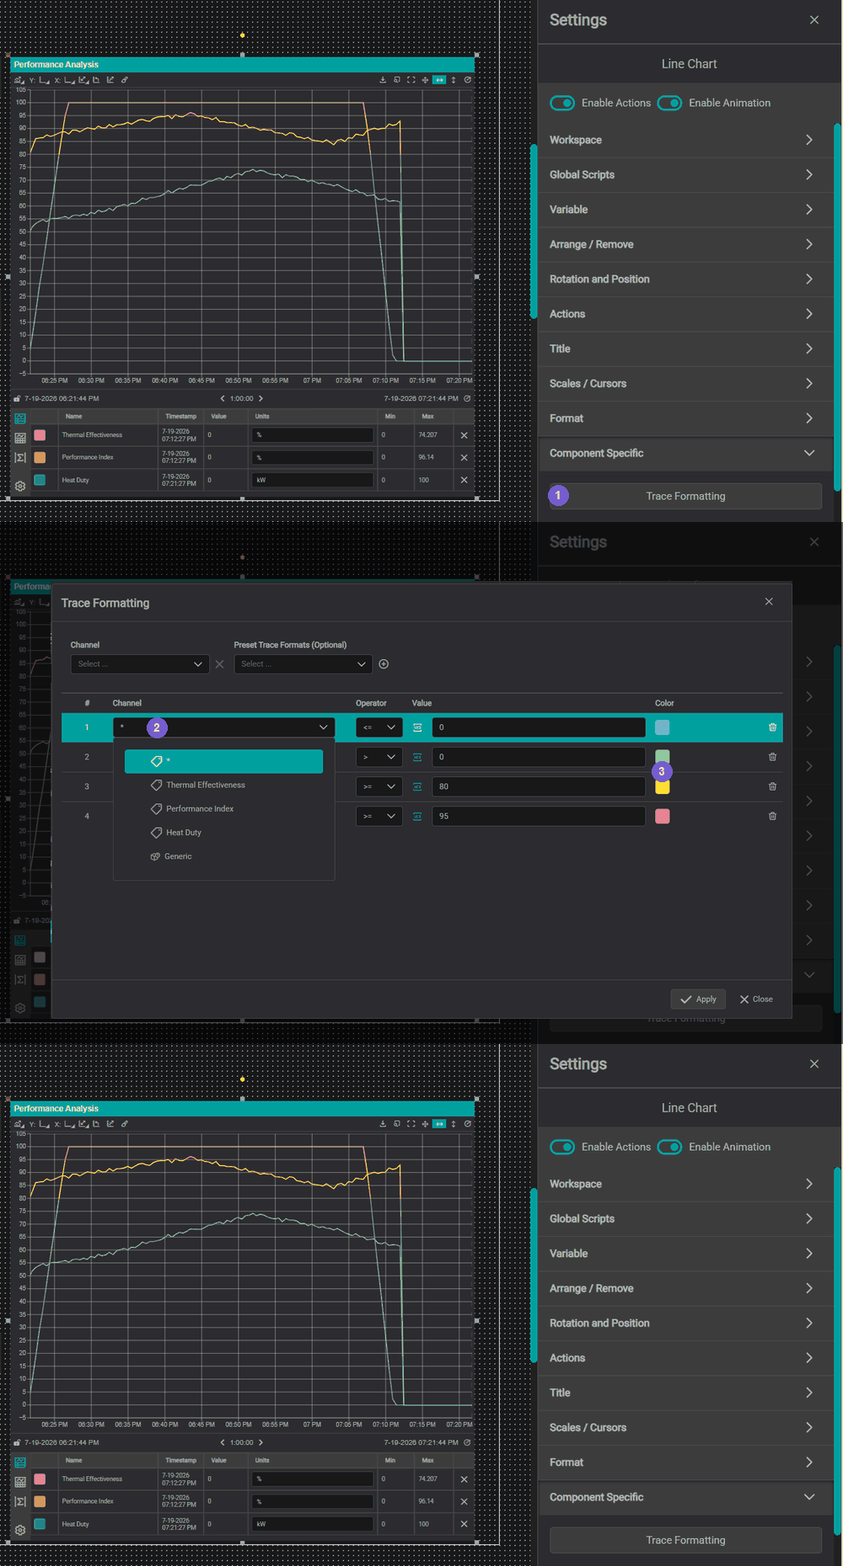
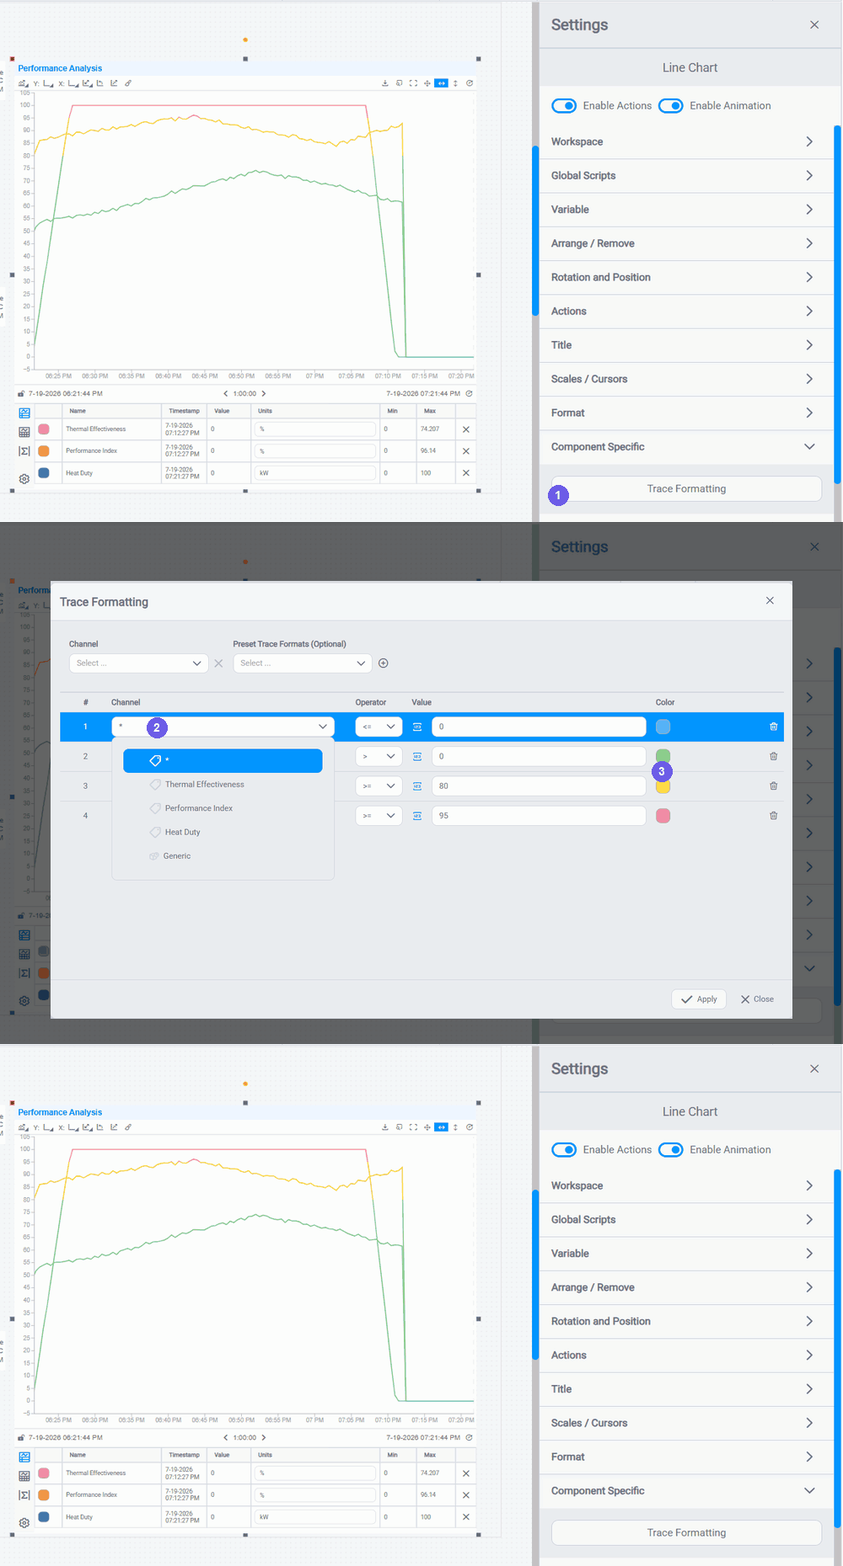
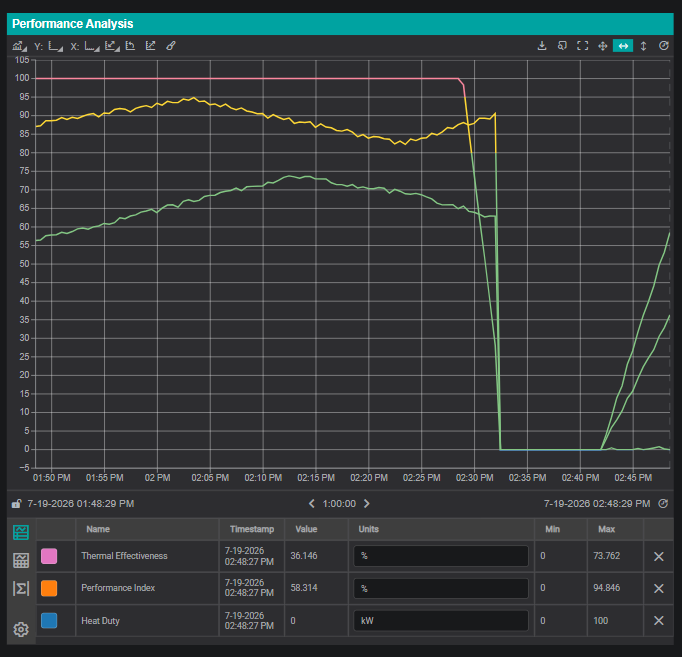
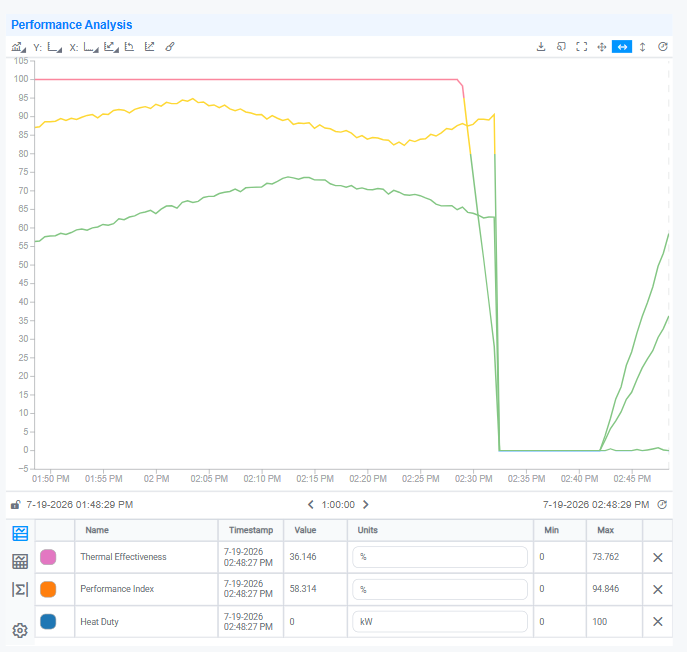
Trace formatting is the line chart equivalent of multistate: it changes the color or style of a trace based on a threshold value. In the heat exchanger display, the Performance Analysis line chart uses trace formatting to color each trace by the band its reading falls in.
Configure it in three steps:
- Select the line chart, then in the Settings panel expand Component Specific and click Trace Formatting.
- In the dialog, pick the Channel to format; choose a specific channel, or
*to apply the conditions to all traces. - Add a condition row for each threshold and set its Operator, Value, and Color, then click Apply. Each trace is drawn in the color of the highest condition it satisfies (here
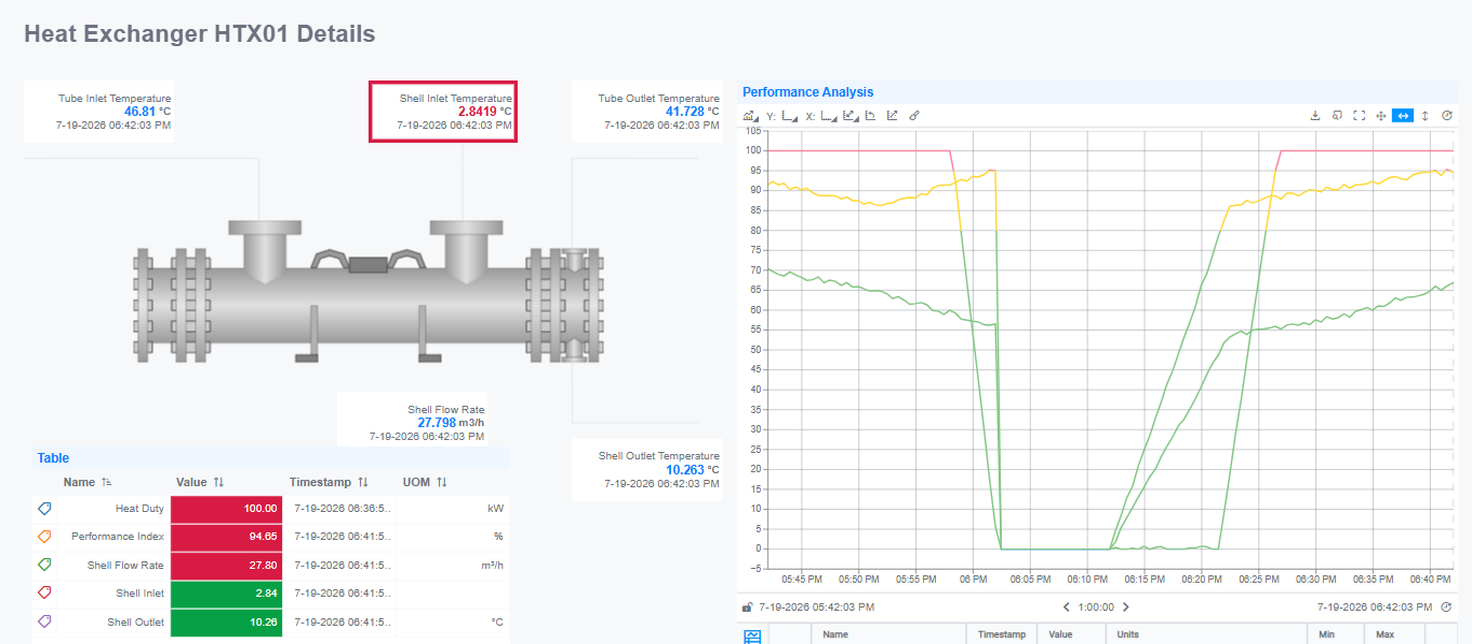
<= 0blue,> 0green,>= 80yellow,>= 95pink).
Known limitation: static limits only
Trace formatting conditions must currently use static numeric values as thresholds. Using another channel's value as the comparison (dynamic limits) is not yet supported: the chart renders a gradient instead of a solid condition color because the condition is evaluated per data point. Dynamic limits are planned for a future release.
Trace formatting also covers static appearance: line color, style (solid/dashed), weight, fill, and markers. For the full reference on all trace formatting options, see Line Chart Deep Dive → Appearance.
The finished Performance Analysis chart, with its traces formatted per the conditions above:
Put together on a locked display, the multistate rules make problems obvious at a glance: here the KPI Table's Value column is colored red/green by threshold and the Shell Inlet Temperature value carries a red alarm border:
Common Use Cases
| Use case | Component | What to configure |
|---|---|---|
| Alarm indication | Value, Table | Background or text color when value exceeds high/low limit |
| Performance status | KPI Table | Green/yellow/red rows based on percentage thresholds |
| Status coloring | Value | Color indicates running / standby / faulted from a digital tag |
| Visibility toggle | Any | Show or hide a component (e.g., an alarm banner) when a condition is true |
| Blinking alarm | Value, any data component | Enable Blink in a Multistate rule to flash the component on/off while the condition is true (visible in a locked display) |
Multistate works on any component
The threshold rules and color conditions here aren't limited to KPI Table and Value. Apply the same patterns to a Gauge needle, a Bar Chart's bars, or a Line Chart's traces. See the Components Reference to explore what each component exposes as a multistate target.
What's Next
With conditional coloring in place, the next deep dive is the workhorse of most process displays: the Line Chart. Continue to the Line Chart Deep Dive for trace formatting, function settings, scale controls, and known behaviors.
Related
- Line Chart Deep Dive: full trace formatting options: color, line style, fill, markers, scale controls, known issues
- Actions & Interactions: triggers, action types, and wiring components together in the Actions panel
- Creating Displays with Tags: the heat exchanger display this page builds on
- Components Reference: full reference for all available components
- Diving into Multistates: Video guide to conditional color and visibility rules driven by data values